

State of the Federation
State of the Federation
March-22 National Accounts Update

Key Points
Volumetric, real growth continues to be underwritten by stimulus working through household and government consumption. We are likely to see further moderation of growth as stimulus unwinds.
This is more the case in Queensland and Western Australia where government consumption is the primary driver underwriting State Final Demand Growth, and more so again in Tasmania and the Northern Territory where it is countervailing strong drags on growth.
In New South Wales, Victoria, South Australia and the ACT, State Final Demand growth is a little more broad based, with household consumption (albeit stimulated) the primary driver.
Queensland and Western Australia are the most vulnerable to a downturn in commodity prices as their state budgets are underwritten by the boom.
National Accounts: what it is, why it matters
The national accounts are the touchstone Australian economic dataset. They give us a picture of the wealth created across the Federation during a quarter year. We summarise this in a single number: Gross Domestic Product (GDP). GDP is added up in three ways:
GDP-E: by expenditure, what some might call the “demand side” of the economy, which includes household and government consumption and investment and international trade.
GDP-O: by output, what some might call the “supply side” of the economy, which adds gross value added by each sector of the economy.
GDP-I: by income, what we might call the “circuit closer”, which adds up income accruing to workers, companies, governments, and landlords.
In this update we will focus on GDP-E because it is the most detailed breakdown by state. In a follow-up, we will focus on GDP-O and GDP-I to round out our analysis.
As always, we use the seasonally adjusted numbers to get a little bit of the volatility stripped out. We also, as is conventional, focus on real GDP, which seeks to hold prices constant across time to get at the underlying volume of production and exchange within the economy.
Again, as always, we like to start by looking at the overall Australian economy. Then we dive into each of the city-states, pairing them as twins: first the Major States (New South Wales & Victoria), then the Resource States (Queensland & Western Australia), then the Festival States (South Australia & Victoria) and finally the Territories (Northern Territory & Australian Capital Territory). We coined the term “Festival States” (in the sense of “Feast”) to call to mind their comparative advantage in food, wine, and general high culture. This gives us a rich view of the makeup of the economy across the Federation and what is driving Australian economic growth.
National growth: driving and restraining forces
Across the Federation, the overall economy grew at a more stately yearly rate of 3.05% over the March-22 quarter, drawing back from a breakneck yearly rate of 15.3% in the December-21 quarter. This marked a moderation of the recovery following prolonged lockdowns in New South Wales in response to the Delta variant.
Figure 1: Growth moderated in the March quarter following a strong recovery from lockdowns in response to the Delta variant.
Growth was restrained (and the moderation caused by) a resurgence of depressed imports, disguising what is still a strong domestic economy across the Federation. Government consumption was the second strongest driver of growth behind household consumption, which is still underwritten by the unwinding of savings from the JobKeeper subsidy. Though even at its height, it contributed little to overall growth, the housing boom has moderated, with new housing and existing housing sales creating a very slight drag on growth.
Figure 2: Growth was restrained by the resurgence of imports, with the domestic economy still otherwise strong due to the ongoing effects of stimulus.
GDP continued to get an extra kick from inventories, which we believe consisted of firms restocking and getting ahead of supply chain shortages.
Activity across Australia’s borders overall dragged on economic growth. However, within them, State Final Demand made good contributions, with growth concentrated particularly in the Major States as they continued to recover from disruptions from responses to the Delta variant. NSW’s contribution was moderated after a very strong December 21 contribution. The Resource States contributed slightly less. Of the Festival States and the Territories, only Tasmania contributed a very slight drag to the overall growth.
Figure 3: Growth in the Major States countervailed negative growth contributed by the international sector.
Major States: New South Wales and Victoria
In the two Major States, growth moderated following a strong recovery from lockdowns in response to the outbreak of the delta variant, with the moderation as with the recovery the lesser in Victoria. State Final Demand in New South Wales moderated to 5.05% yearly from 30.94%, and in Victoria to 3.5% from 14.47%.
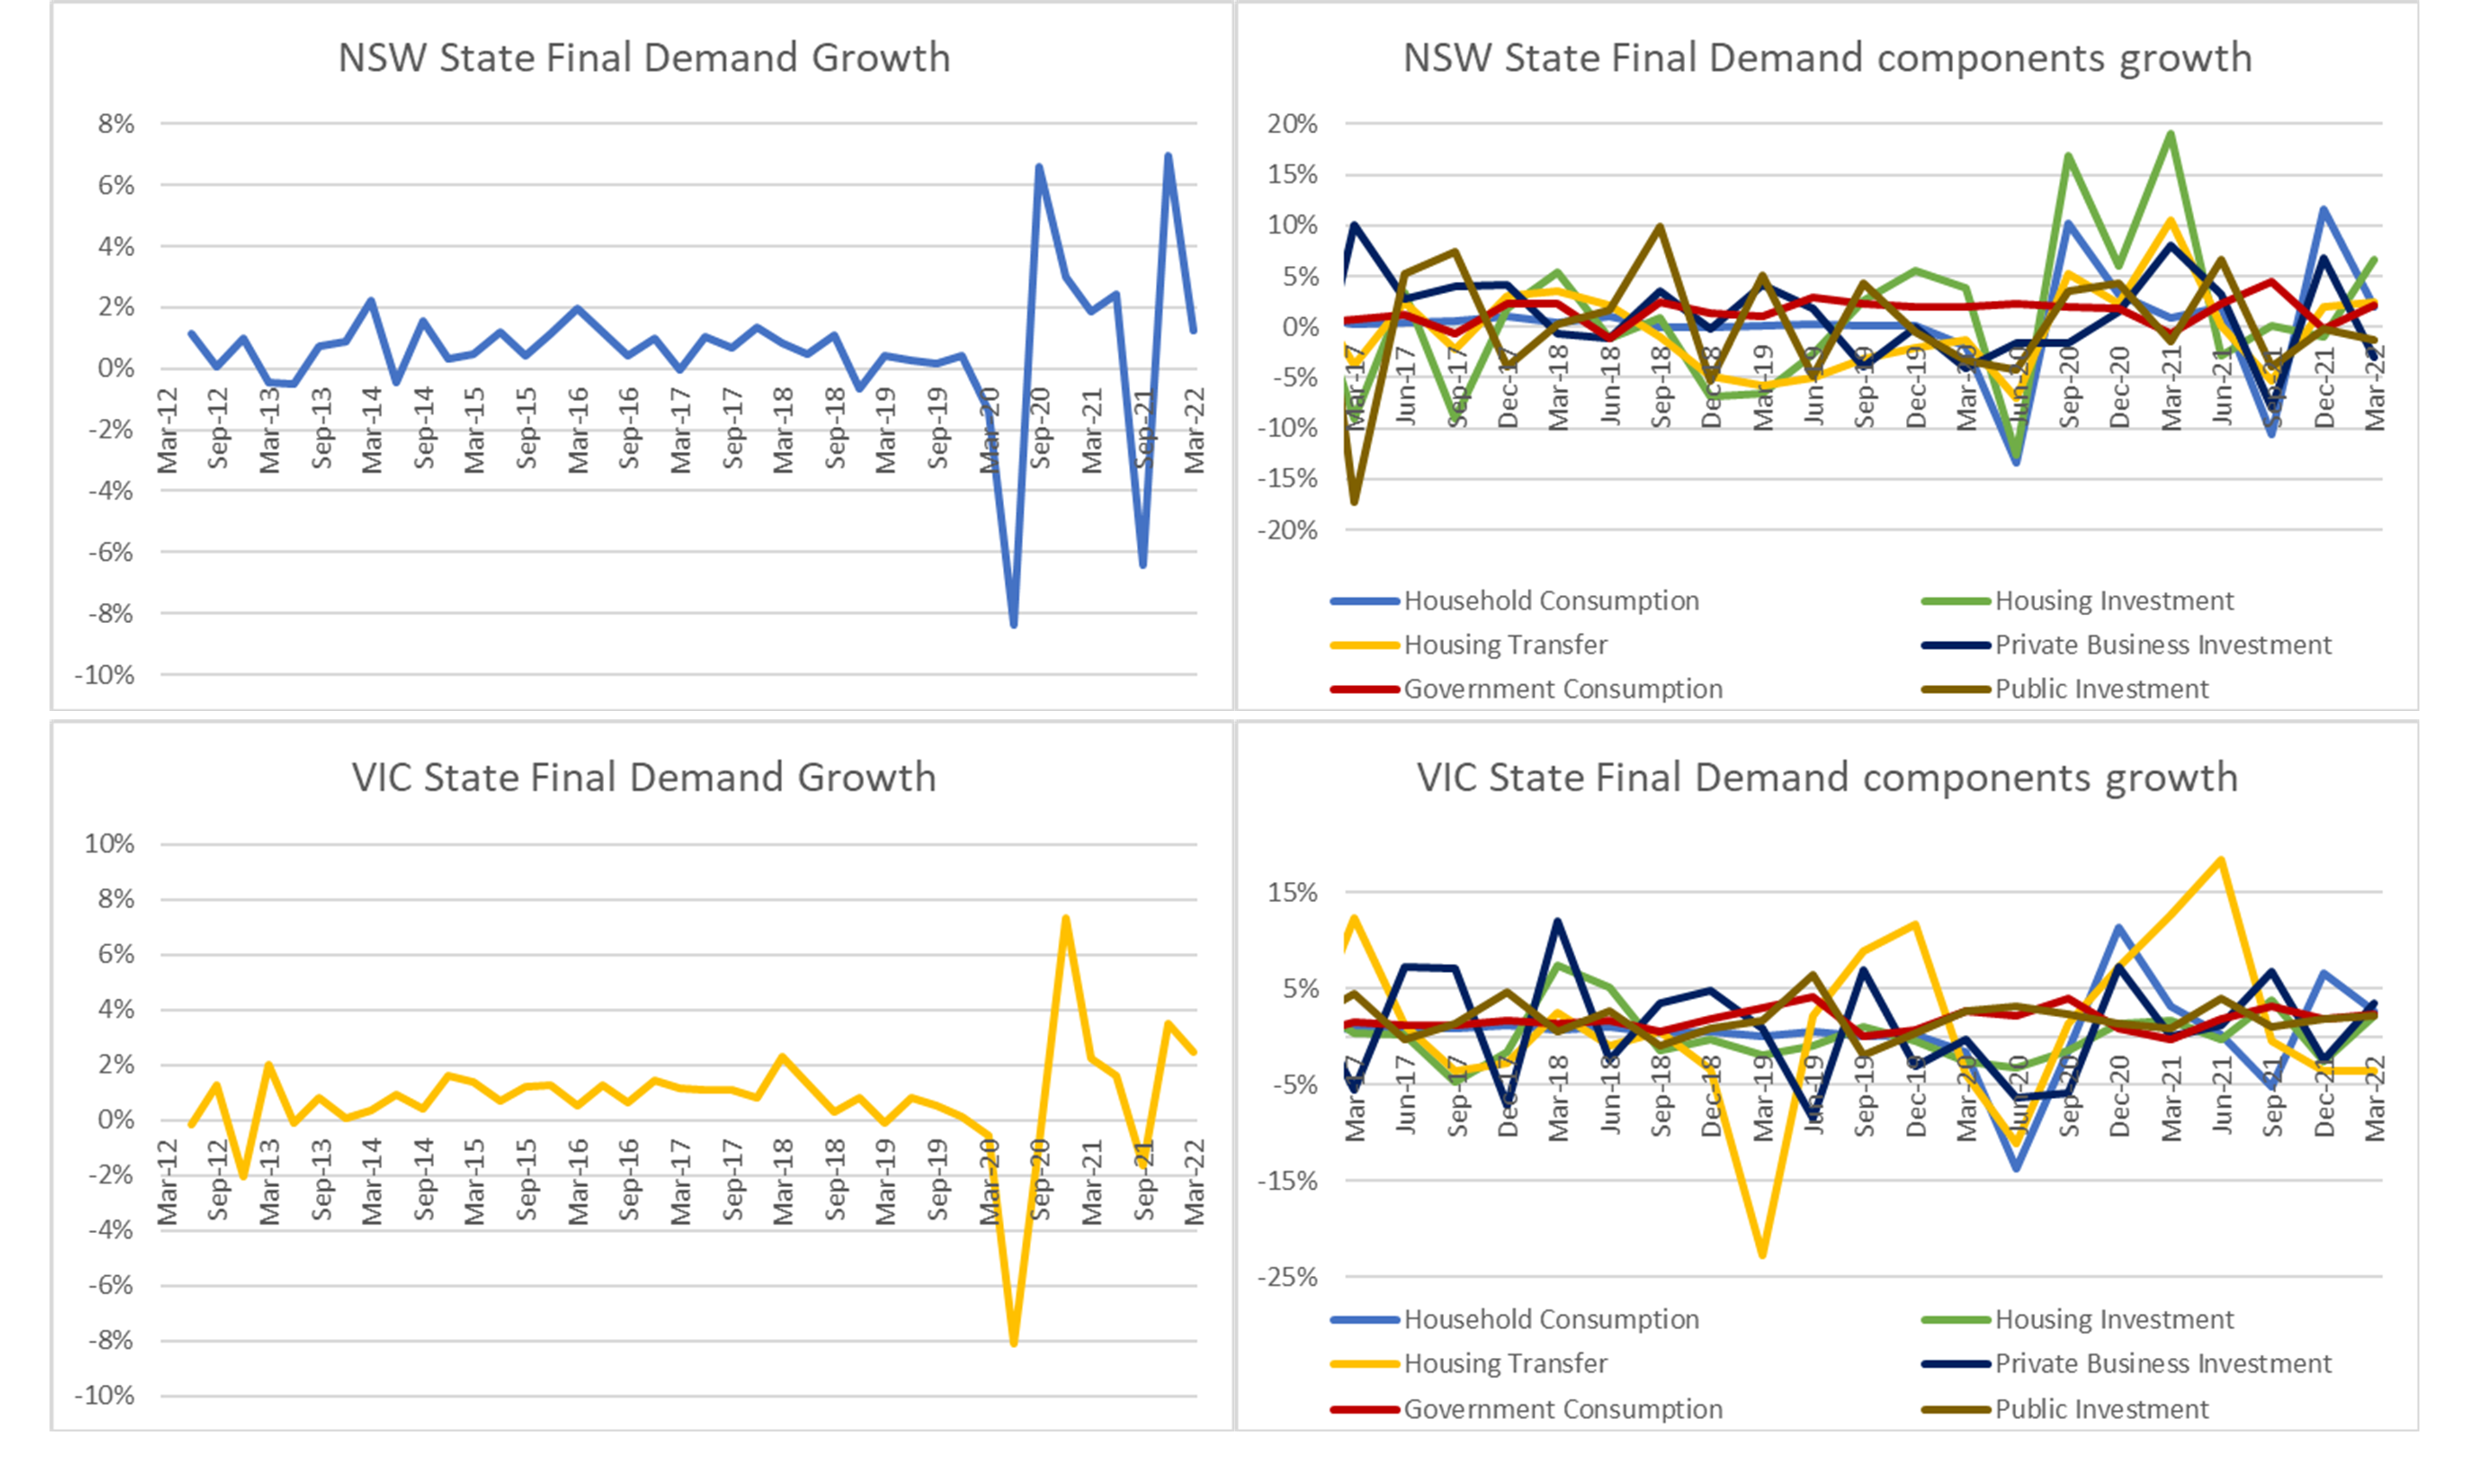
Figure 4: Growth moderated in the major states following the recovery from Delta restrictions, with Victoria the lesser in recovery and moderation than New South Wales.
Growth was driven in both states primarily by household consumption underwritten by the unwinding of savings from the JobKeeper subsidy. In New South Wales, a strong contribution was made by government consumption and a nearly equivalent drag was created by private business investment after a strong number was posted in December-21. In Victoria, household consumption was accompanied by strong government spending both consumption and investment to drive growth.
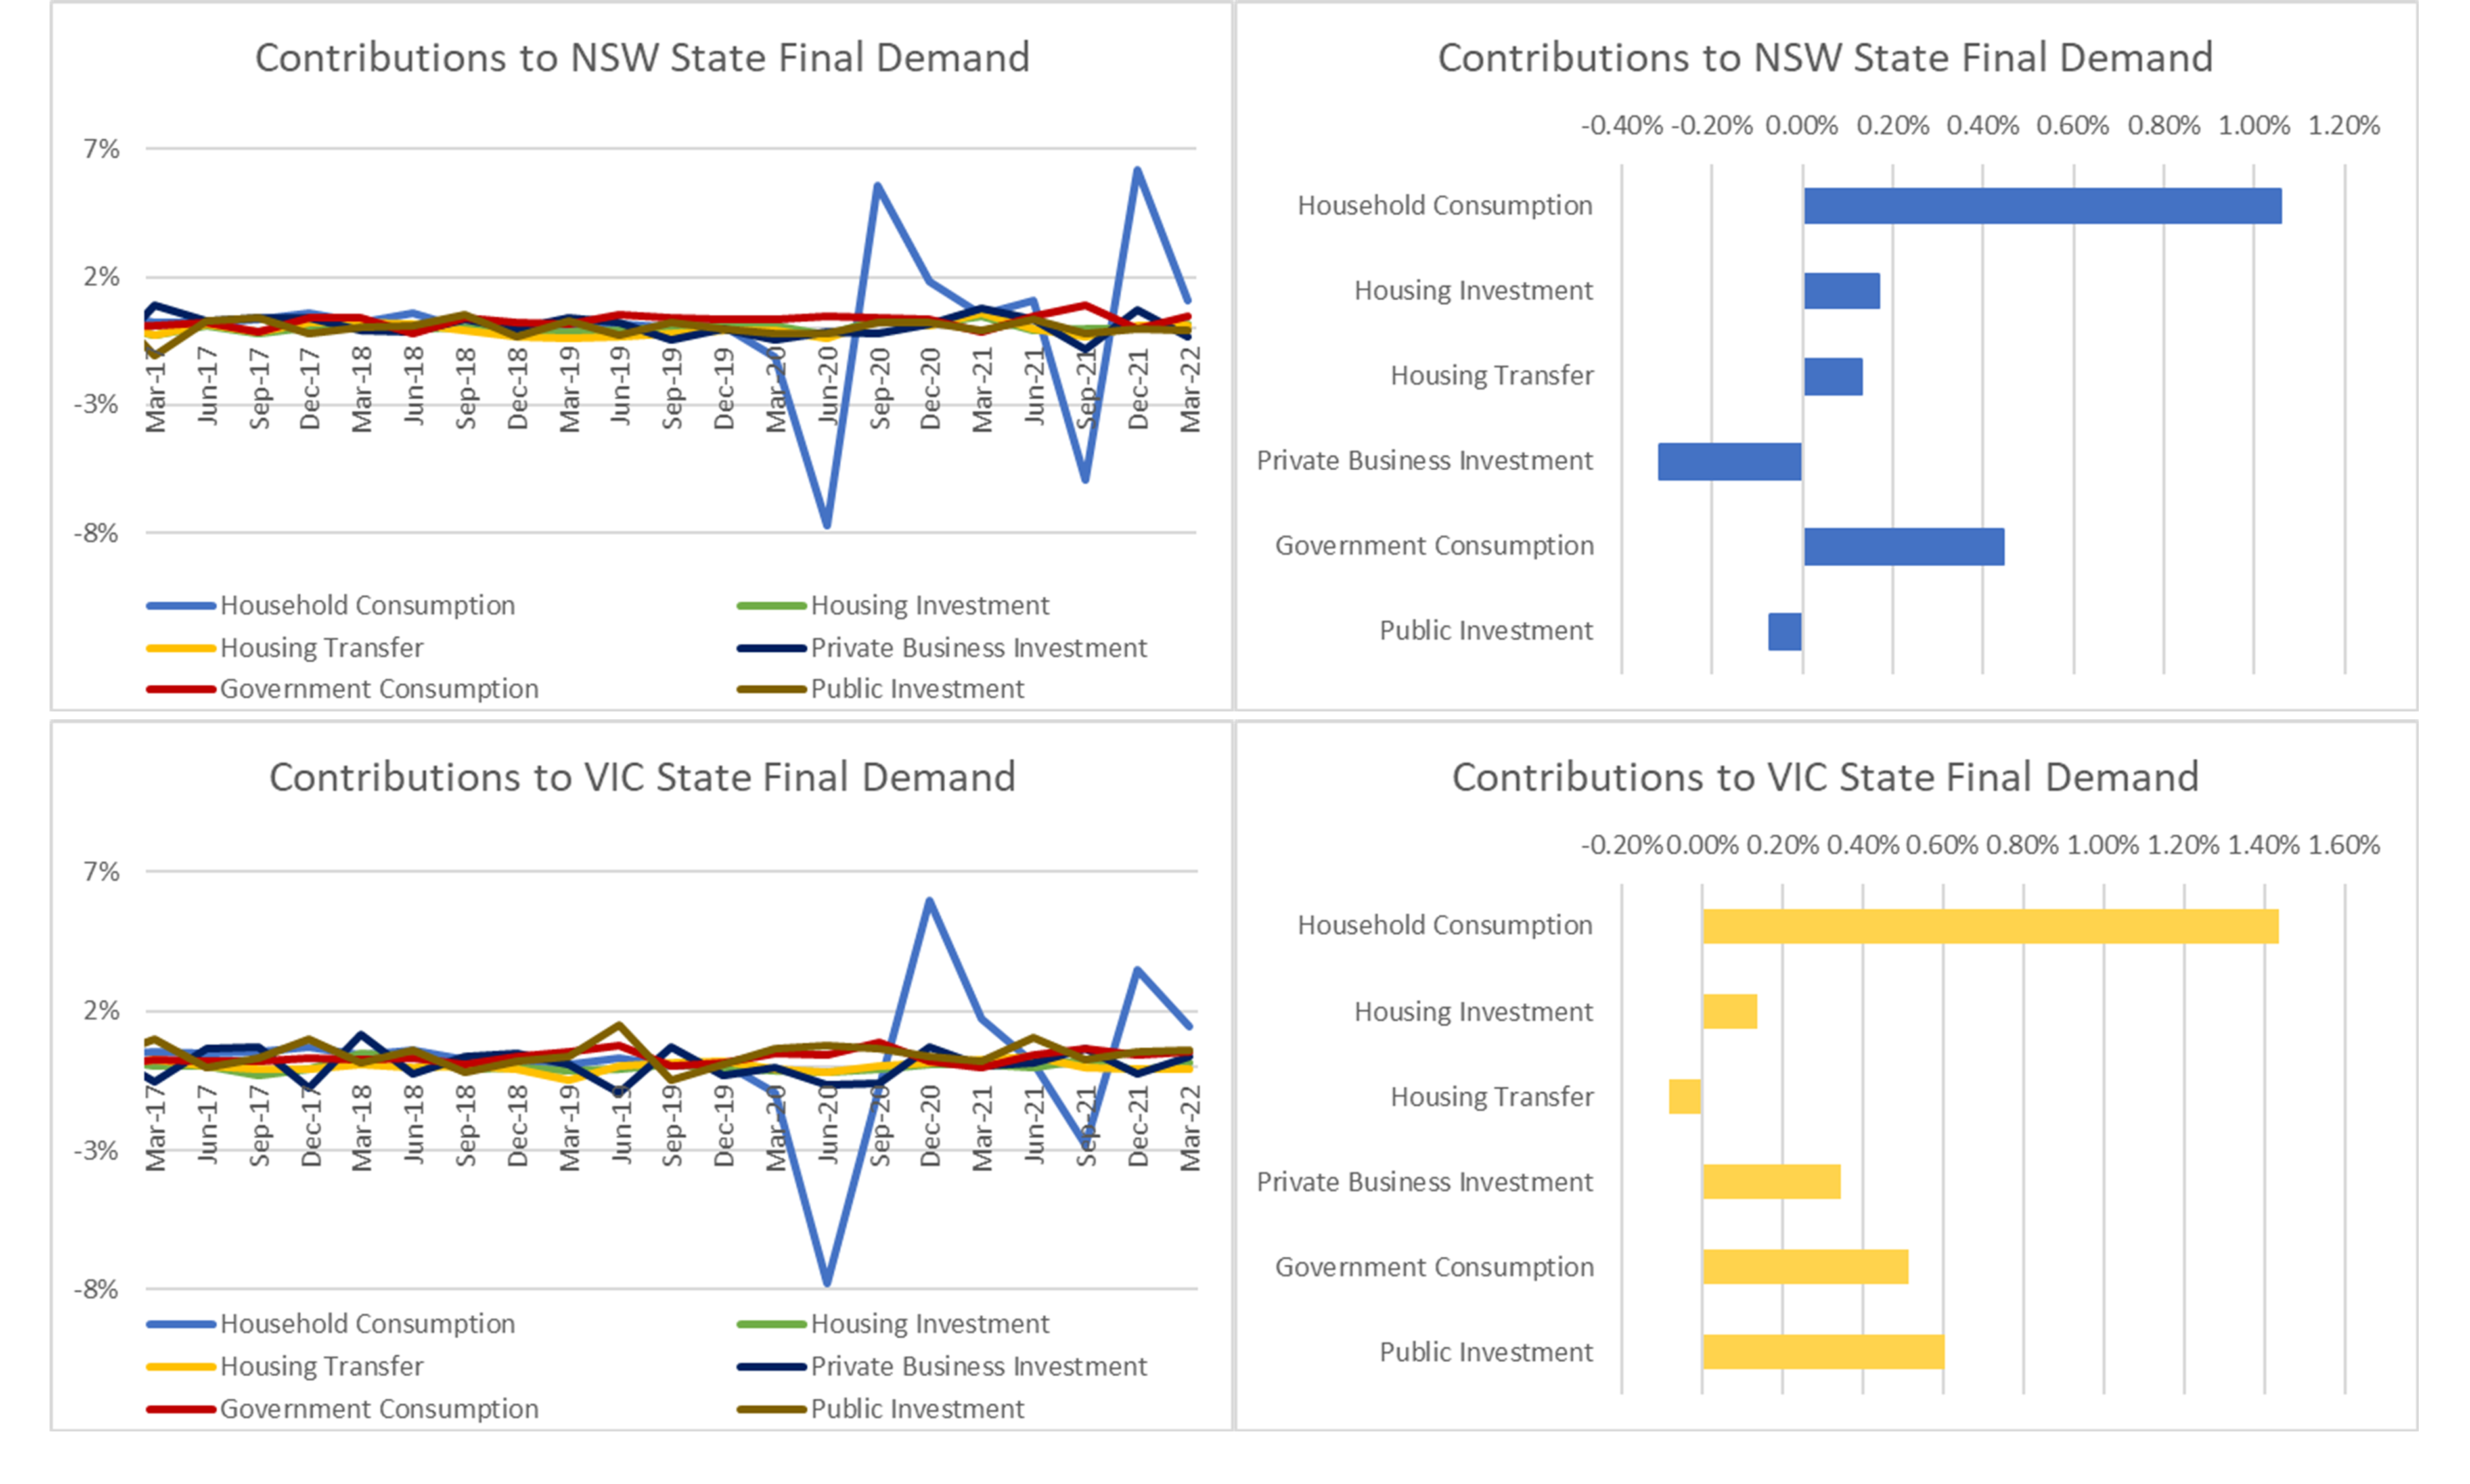
Figure 5: In both Major States, household consumption was the primary driver of growth, with government consumption (and investment in Victoria) coming in second.
In both states, new housing continued to contribute to growth, with the contribution made by new housing strengthening and that made by the sale of secondary stock easing. In Victoria however, the secondary market moderated enough to create a slight drag on growth.
The Resource States: Queensland and Western Australia
In the two Resources States, relatively unaffected by lockdowns due to strong interstate borders, growth picked up in the midst of a strong global commodities boom. State Final Demand growth picked up to 2.24% from 1.35% yearly in Queensland, and from an even stronger 3.23% to 9.17% in Western Australia.
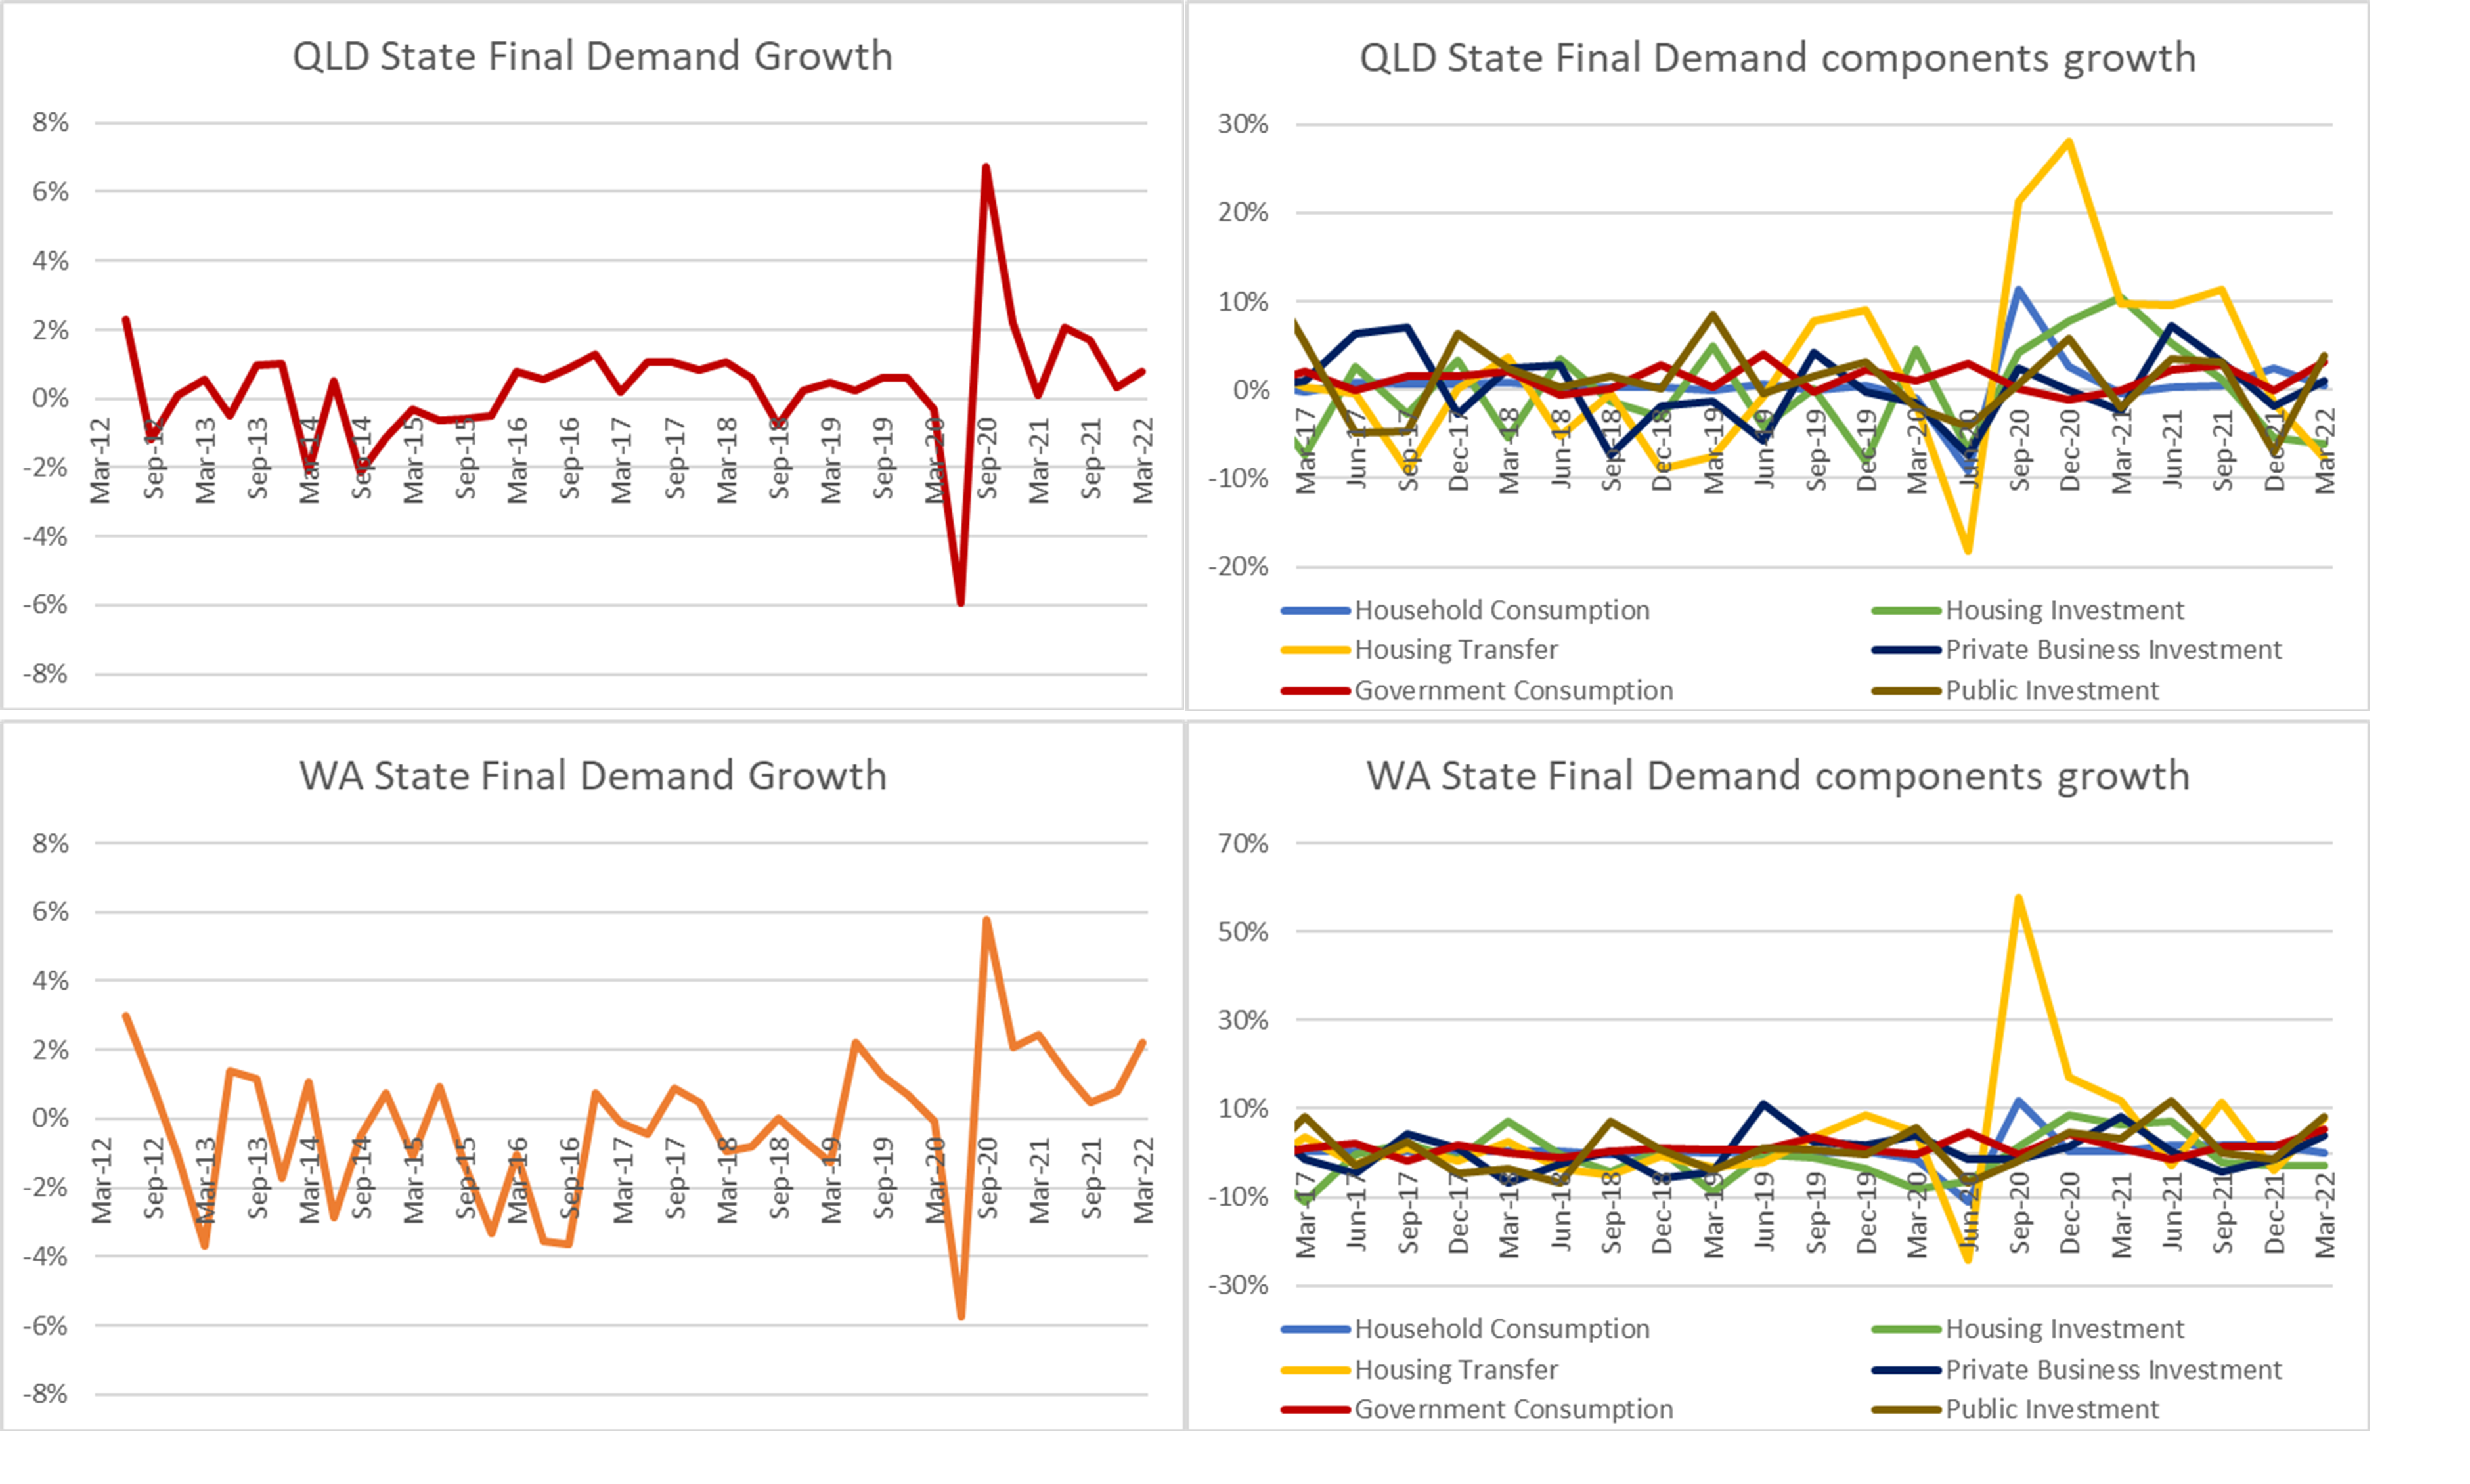
Figure 6: State Final Demand growth strengthened in the Resource States, with Western Australia picking up to even stronger growth than Queensland.
Because we are dealing here with State Final Demand (only the State Accounts provide breakdowns of international trade by state), this reflects strength within the domestic economy of these states.
In both states, growth in State Final Demand was driven strongly by government consumption – suggesting that the state governments are making the most of the global commodities boom. In Queensland the housing boom is definitely over, with both new stock and existing stock transfer countervailing increased government spending. In Western Australia, new housing dragged on growth, but was more than offset by a surge in private business investment, which continued to rebound after a shaky 2021.
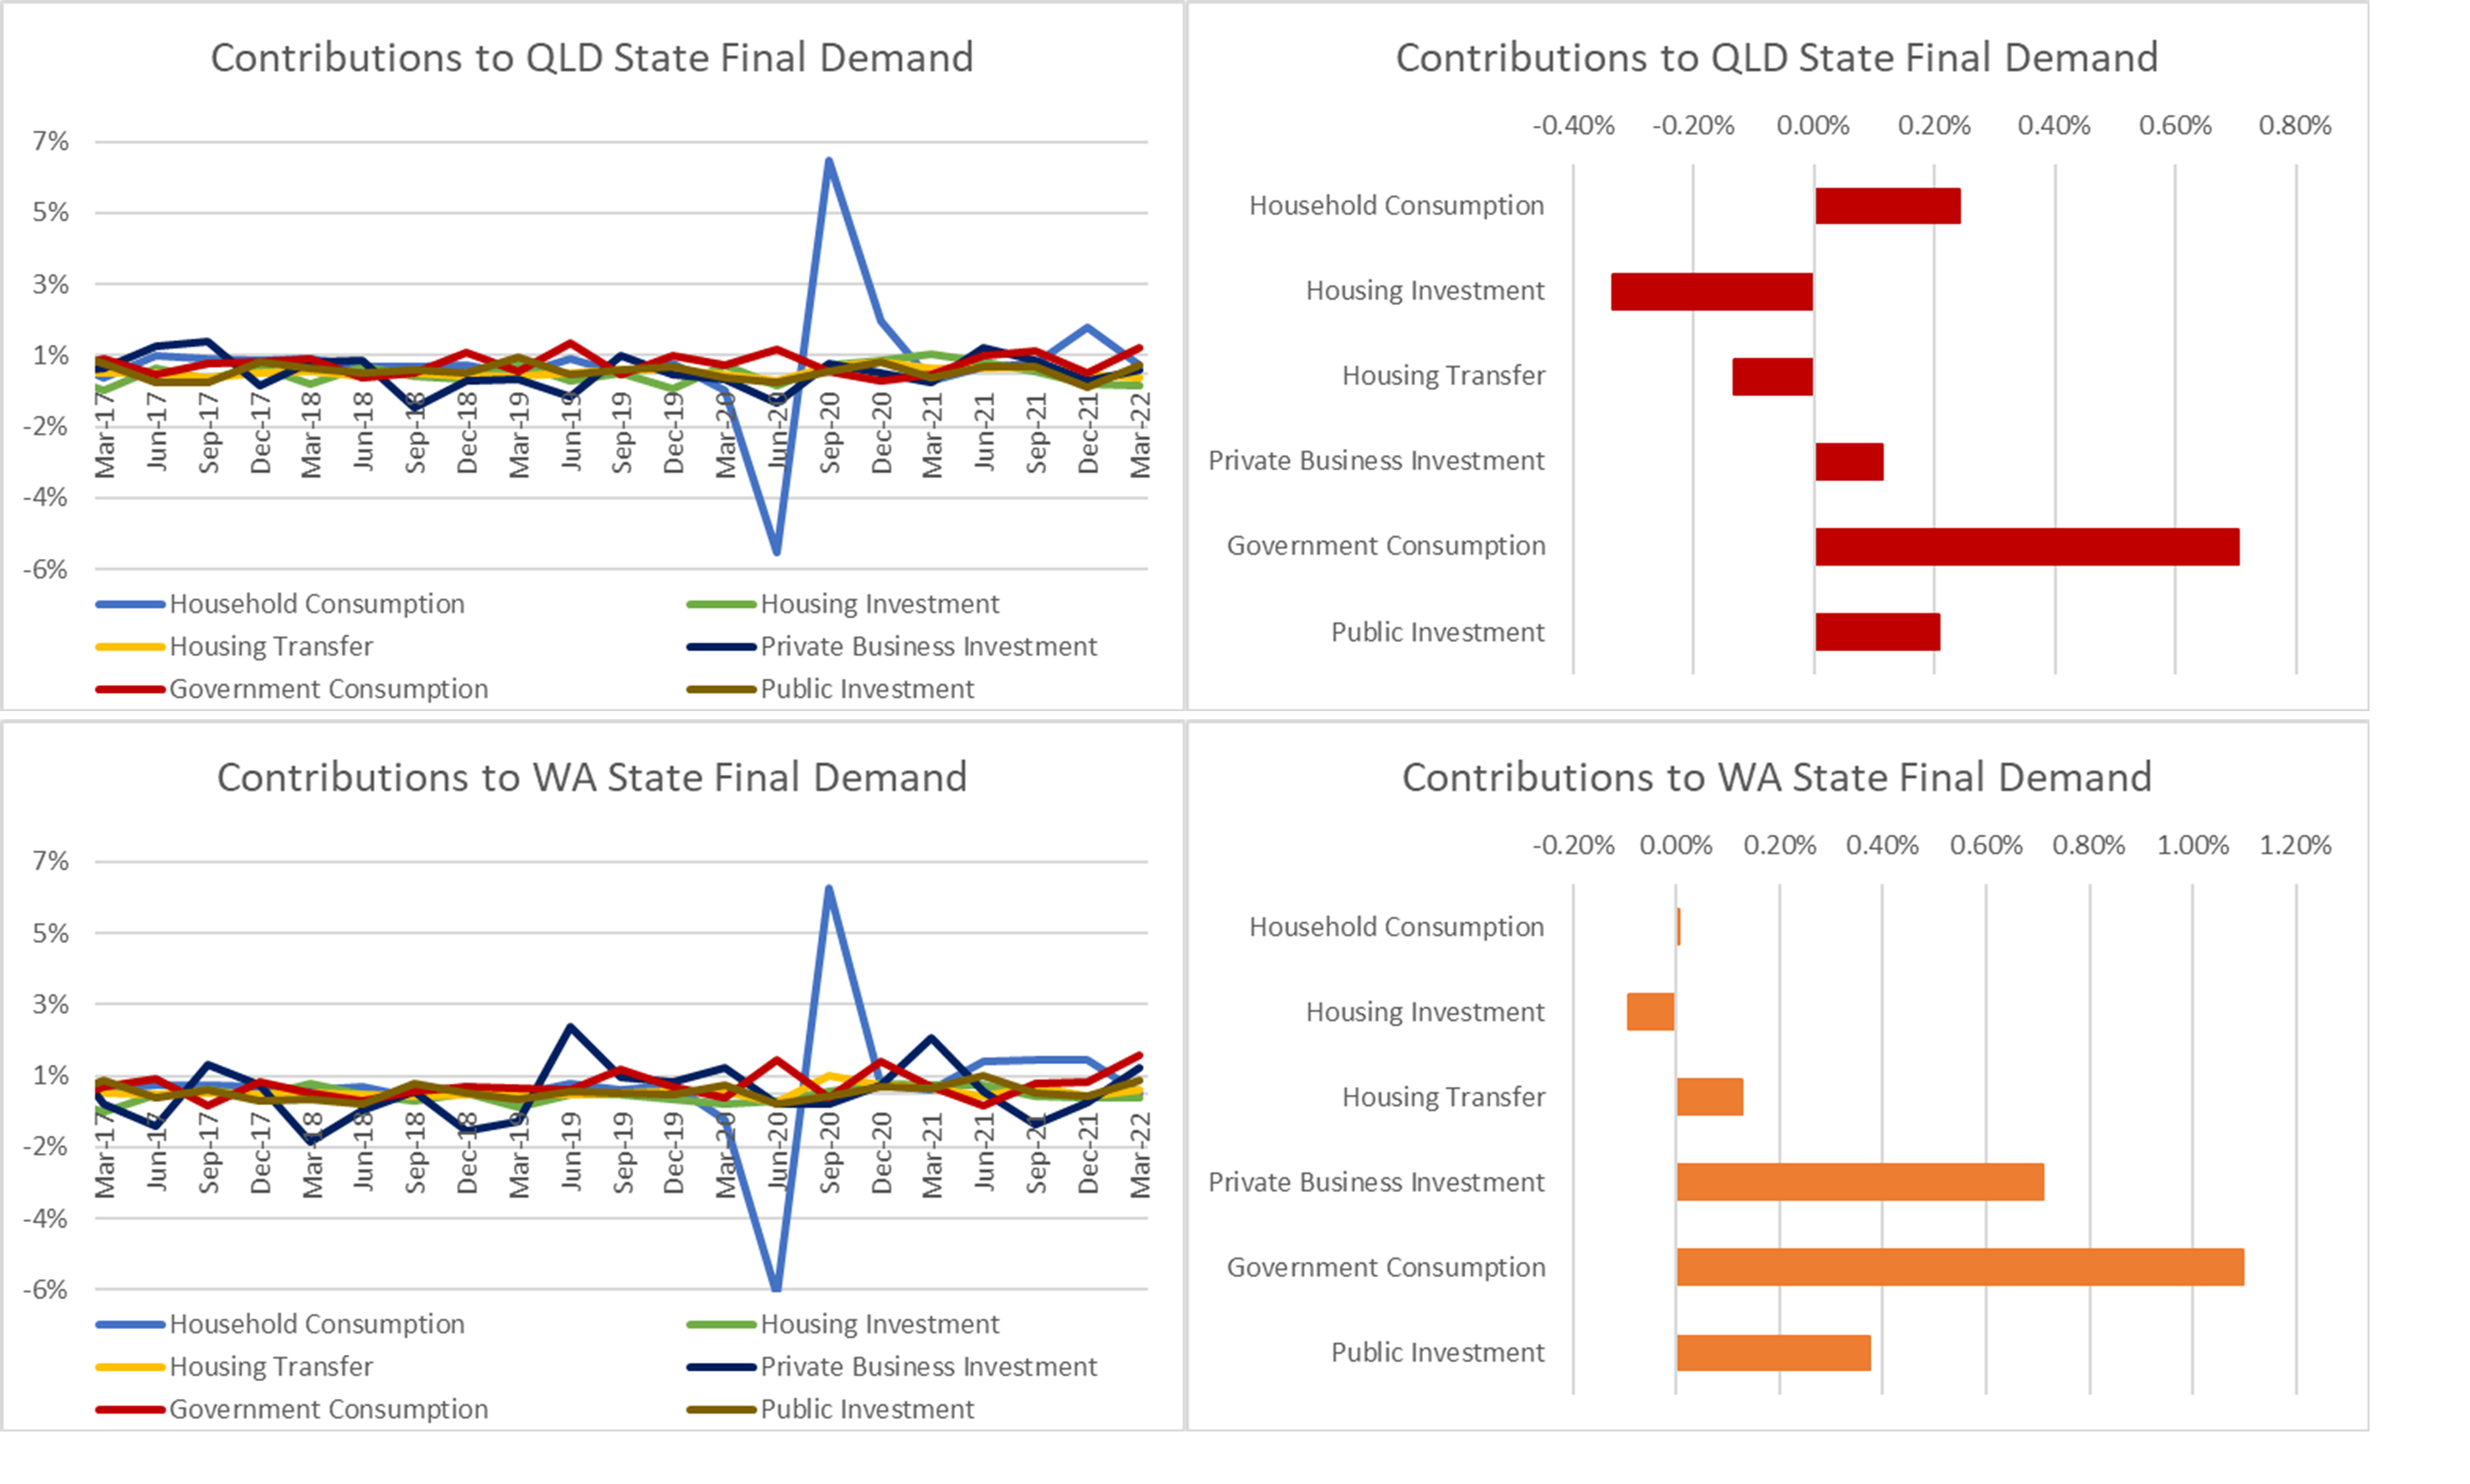
Figure 7: State governments are making hay while the sun shines on the Resource States, with State Final Demand growth underwritten by government consumption especially.
The Festival States: South Australia and Tasmania
The two Festival States diverged slightly over the March-22 quarter. Both South Australia and Tasmania recovered from a decline in growth. However, in South Australia growth improved slightly from 2.92% to 3.37% yearly, while in Tasmania, a State Final Demand recession moderated from a -6.08% to -2.52% decline.
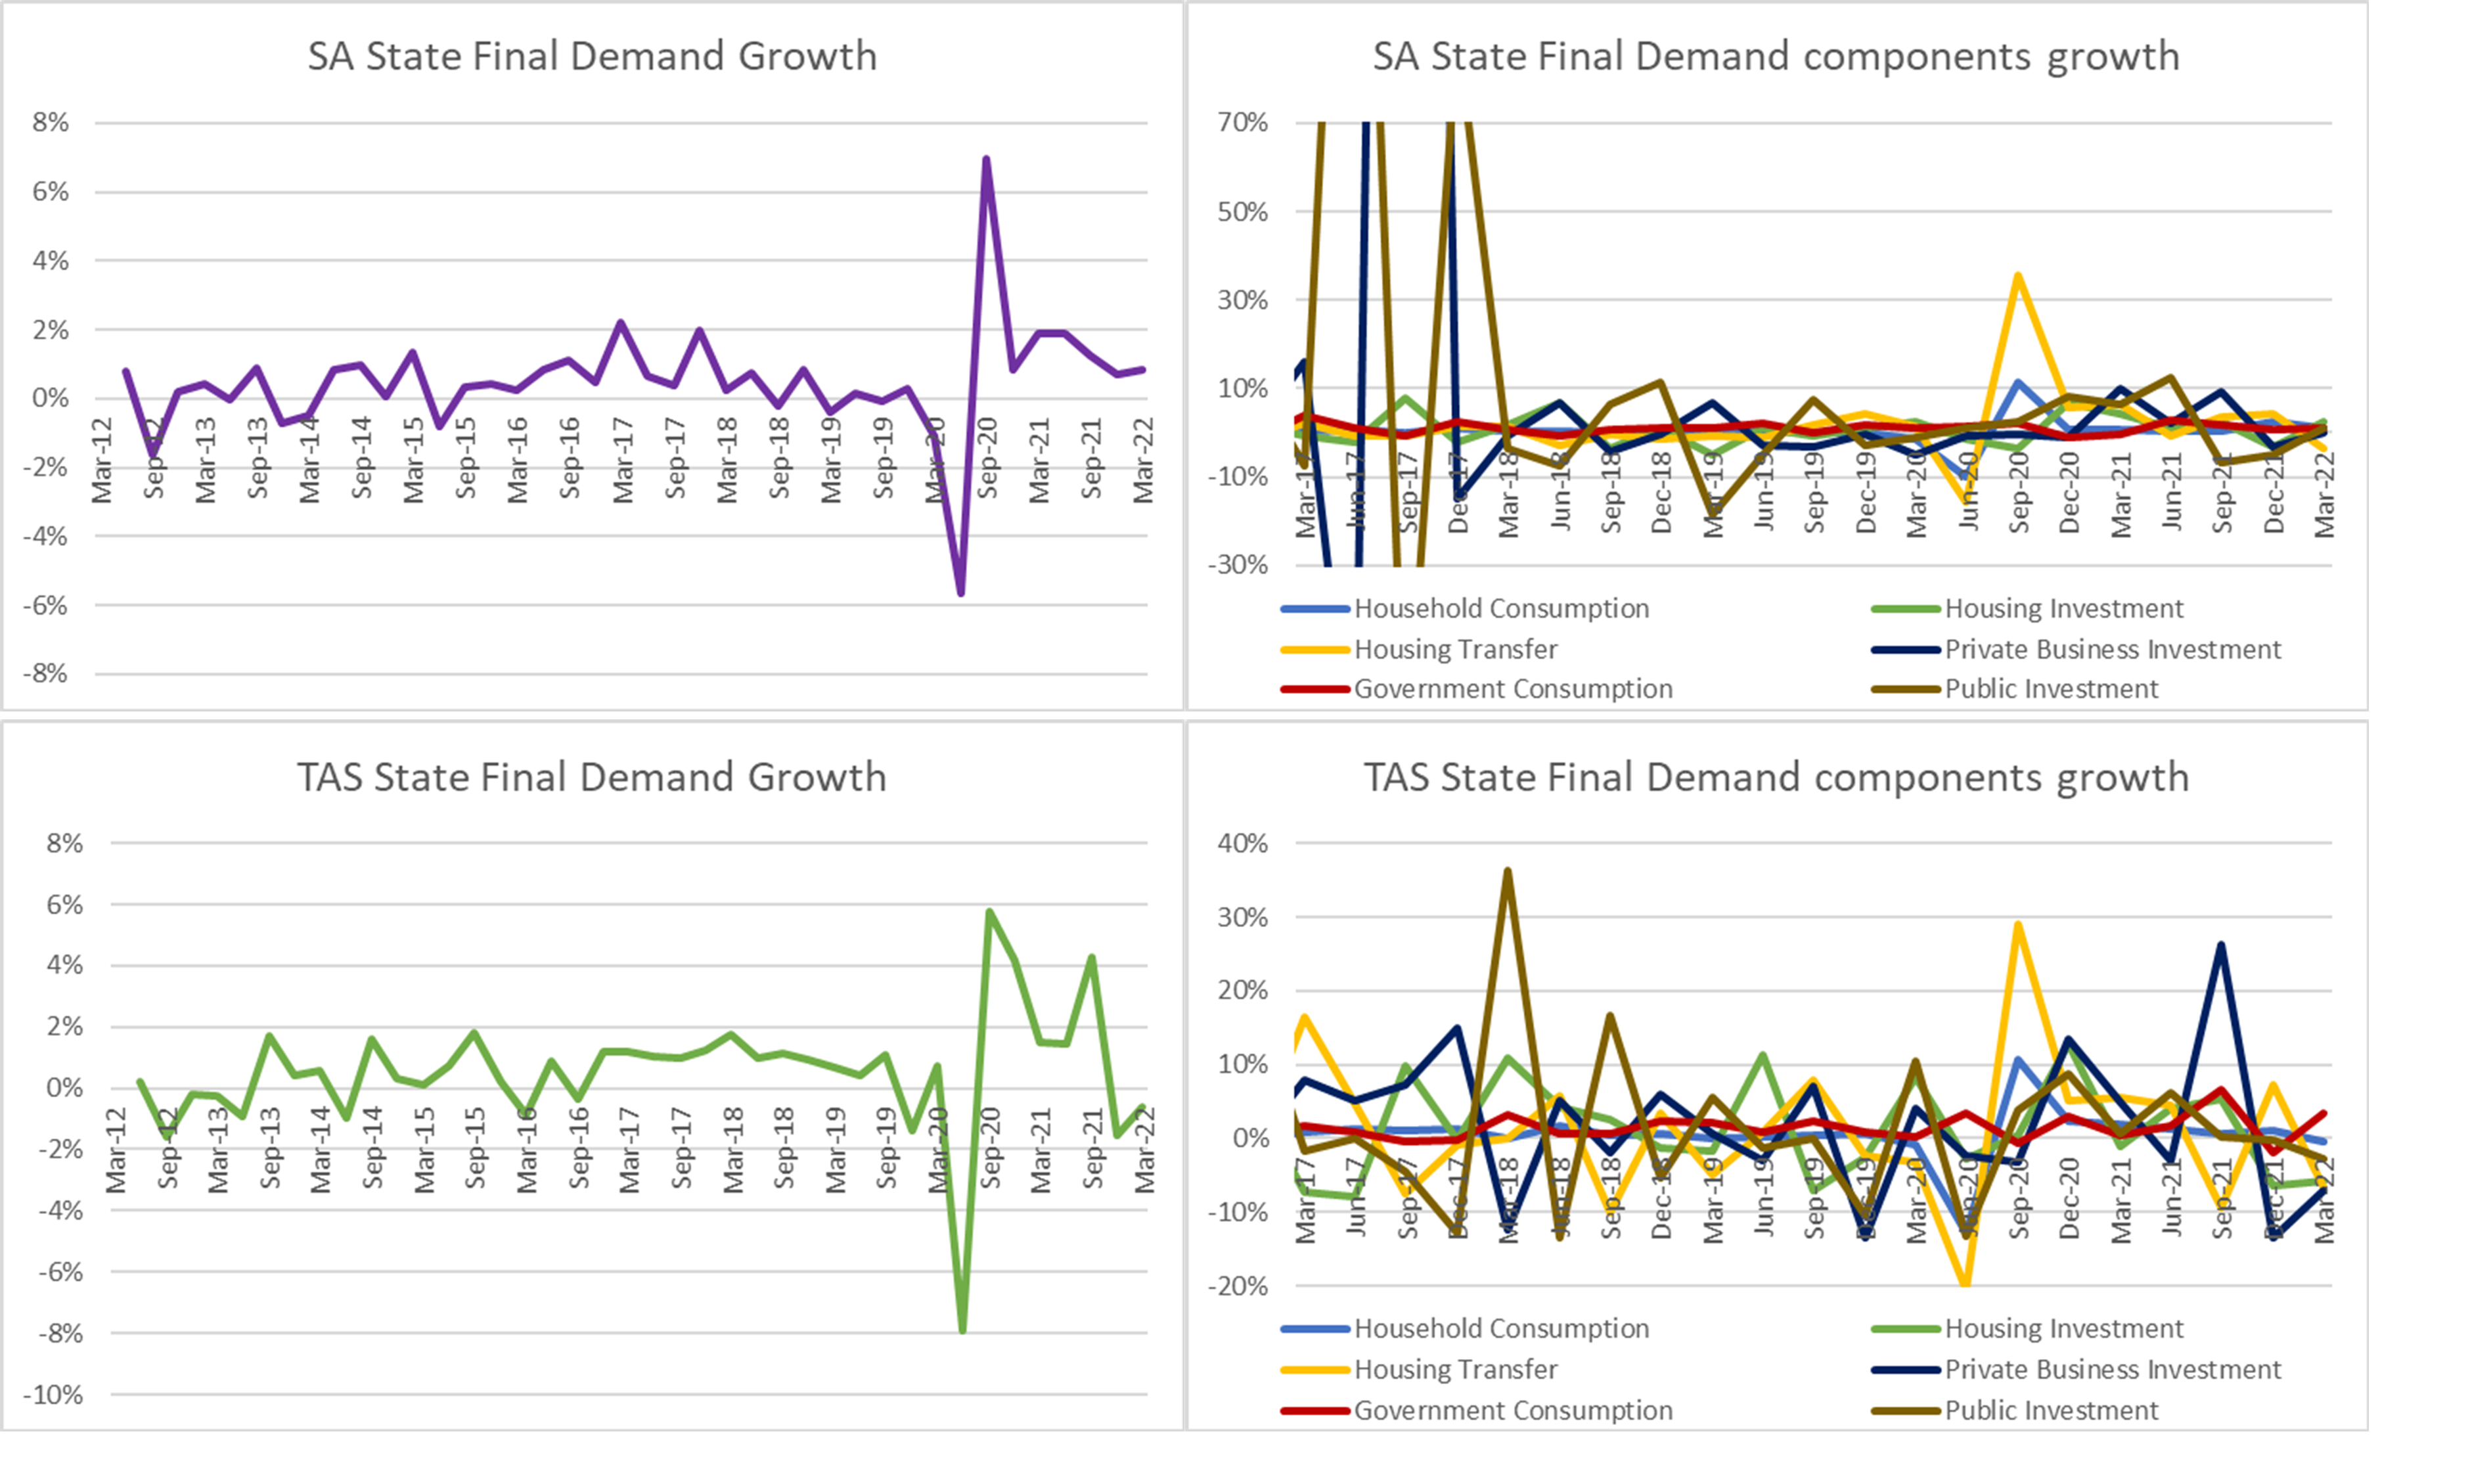
Figure 8: Growth improved in the Festival States, with South Australia posting good growth, and a State Final Demand recession in Tasmania moderating.
In South Australia, the strengthening of State Final Demand growth was primarily the result of stimulus: strong household consumption underwritten by unwinding JobKeeper subsidies was compounded by government consumption. Only the secondary market for existing housing stock created a substantial but slight drag on growth, with private business investment an even slighter drag. In Tasmania, the moderation of the State Final Demand recession was the result entirely of government stimulus, with all other expenditure categories continuing to decline, albeit with a moderation of private business investment declines.
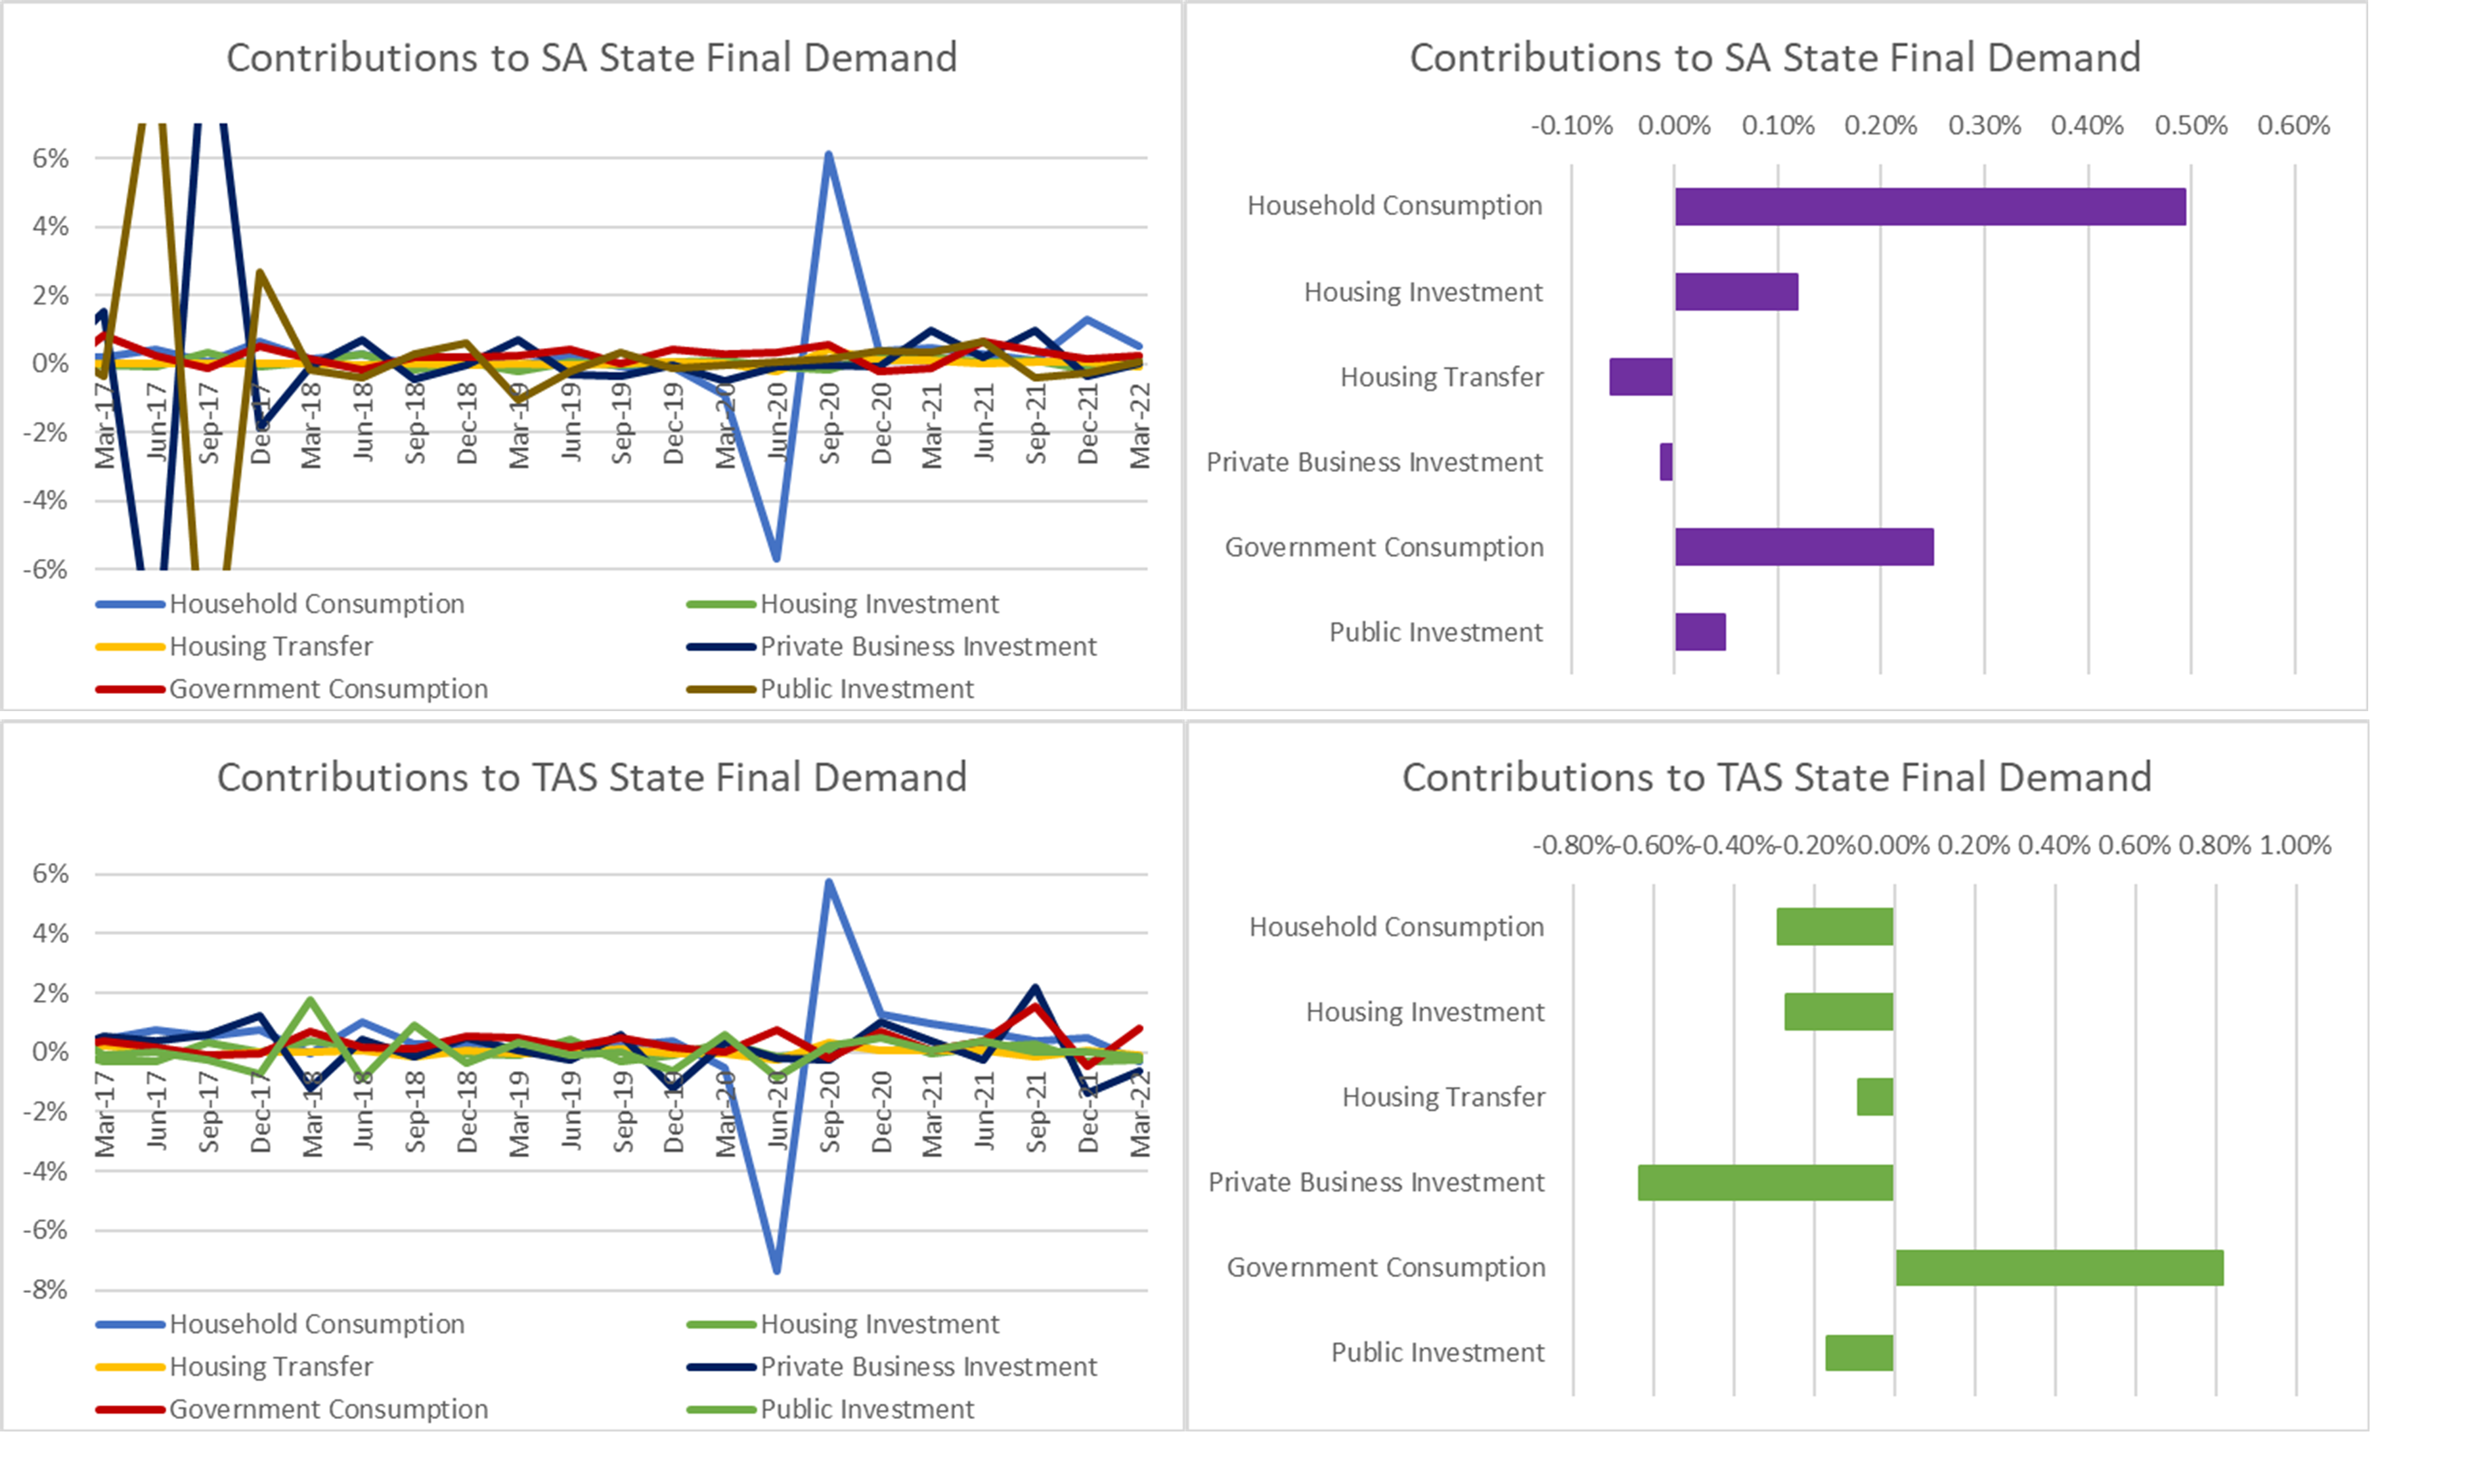
Figure 9: State Final Demand Growth was underwritten by stimulus in both the Festival States, but the dependence was greater in Tasmania.
The Territories: Northern Territory and Australian Capital Territory
The Territories are characterised by substantial volatility compared to the States, with a shallower market and more contingency upon government (military in Darwin, Federal administration in Canberra). The Northern Territory saw growth flip from -3.65% to 9.21% yearly State Final Demand growth, while the Australian Capital Territory saw growth moderate from 8.54% yearly to 1.73%.
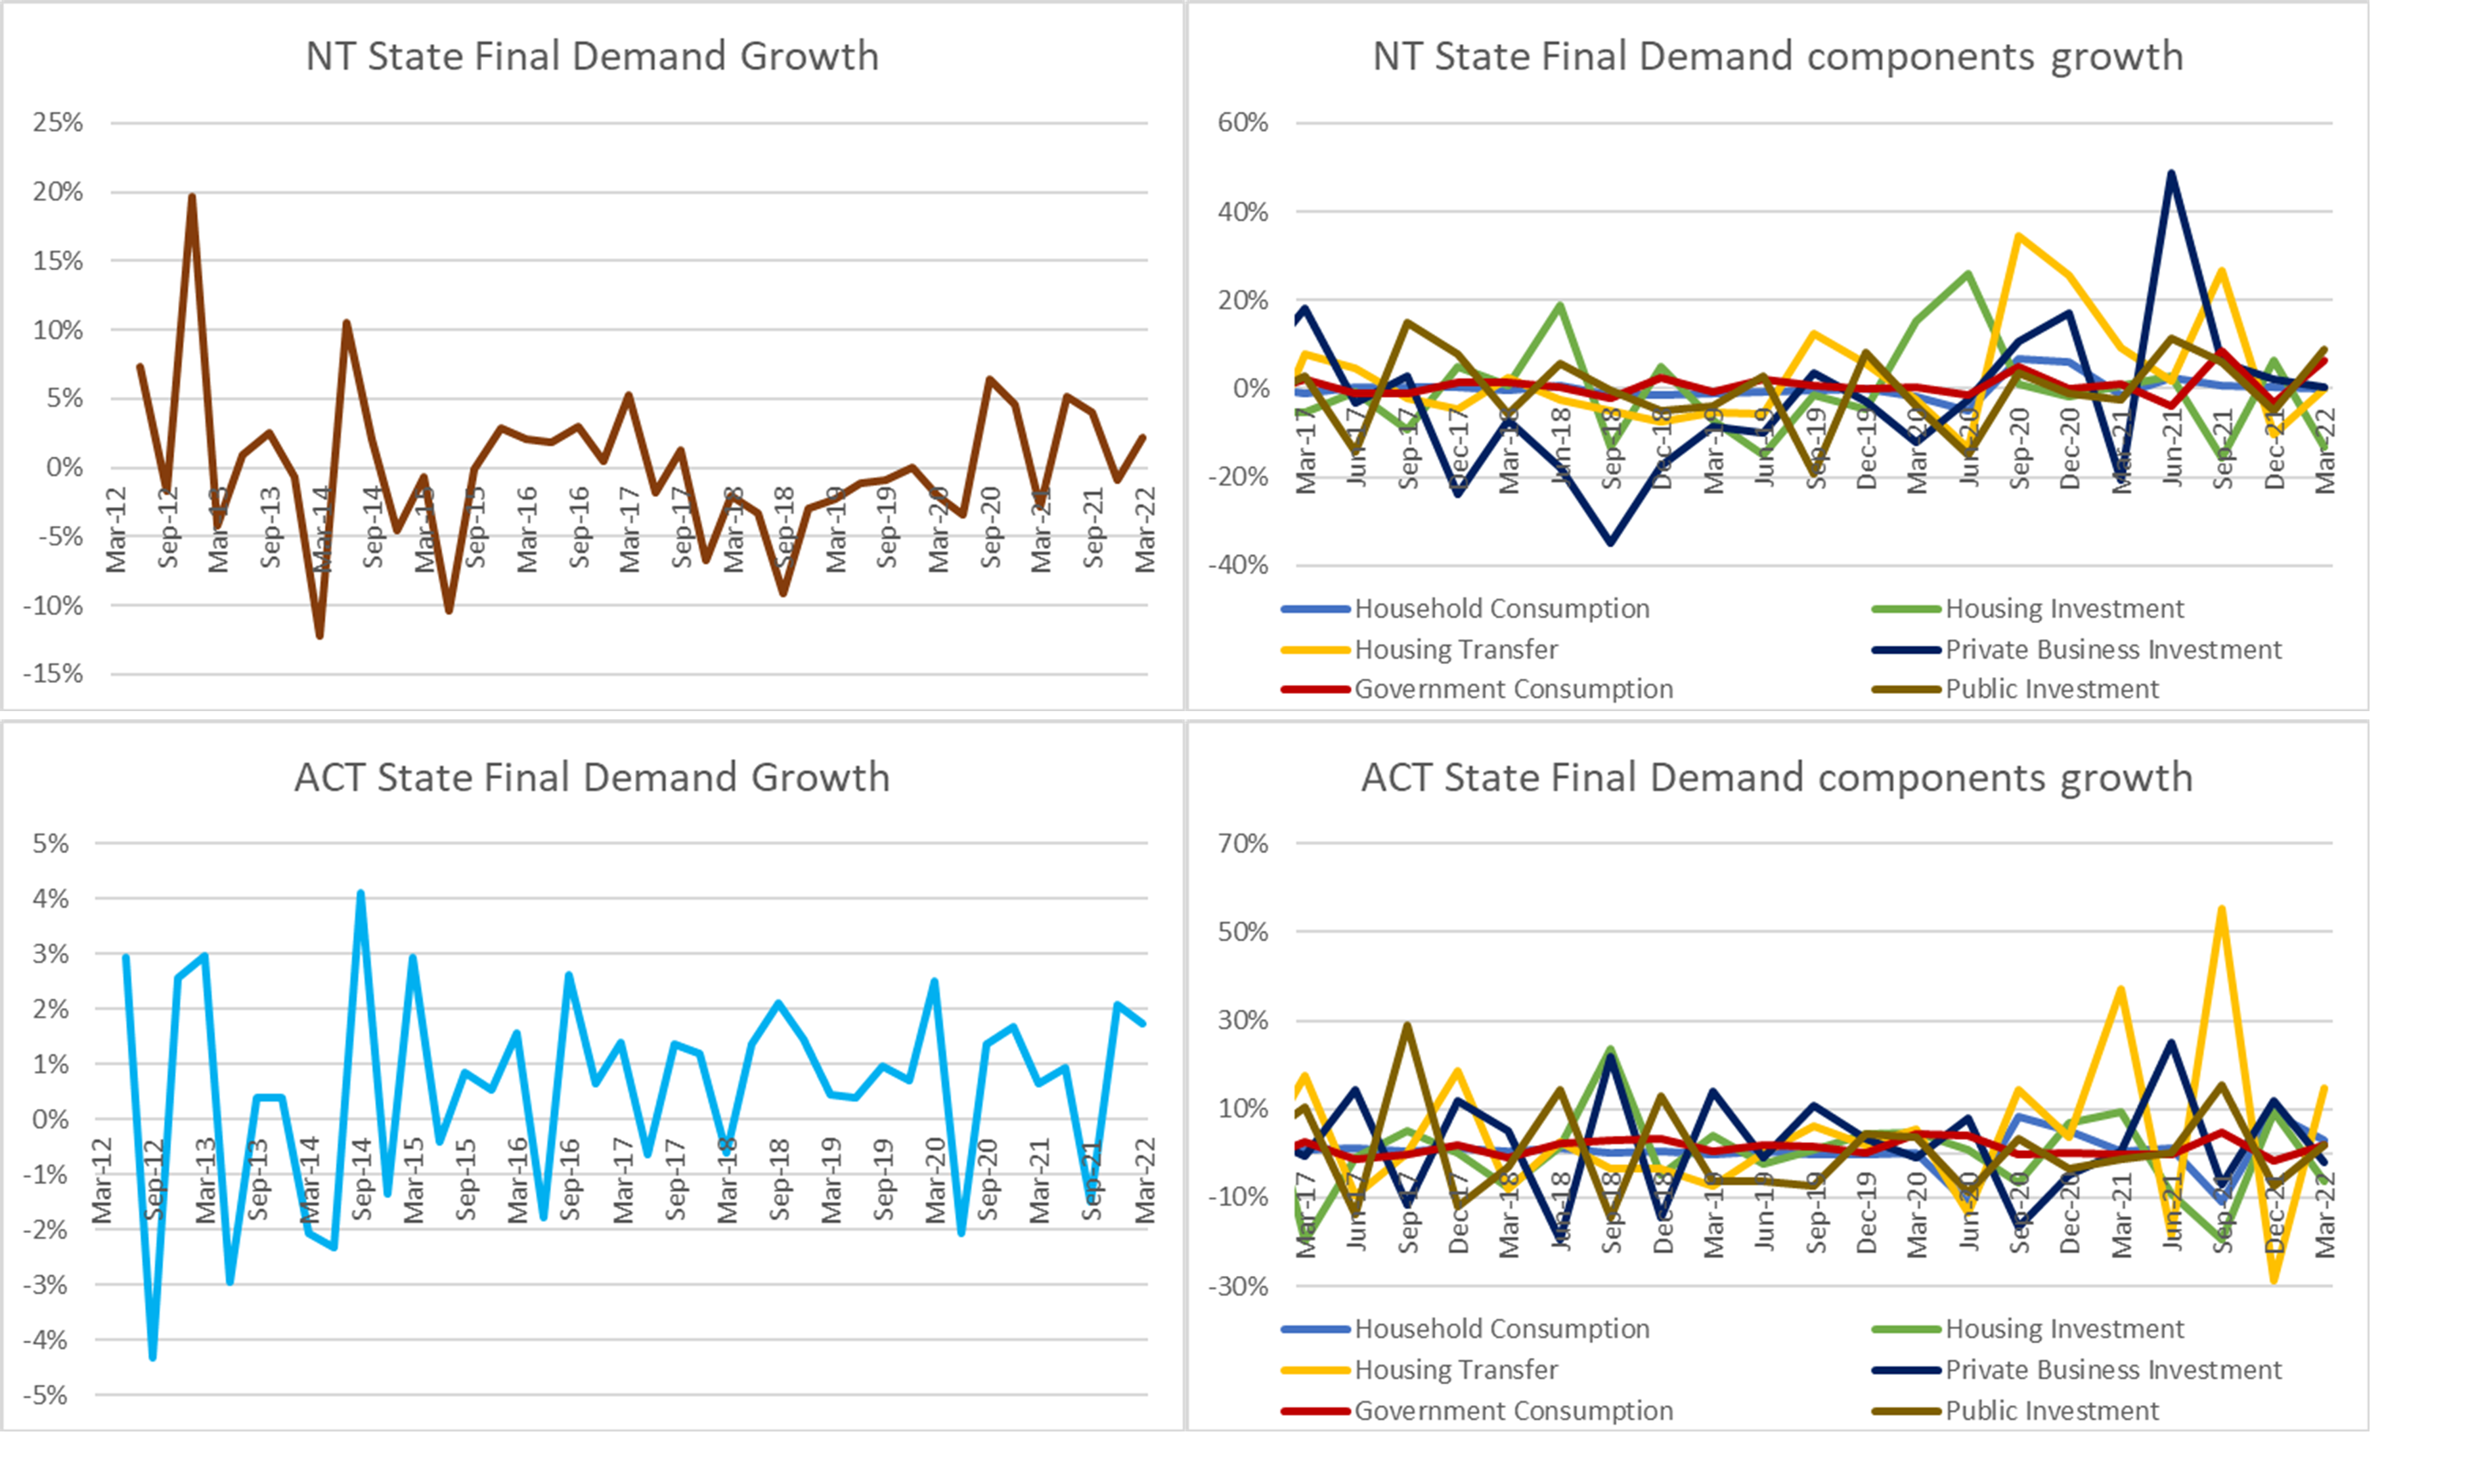
Figure 10: The Northern Territory saw growth return after a short mild decline, while the Australian Capital Territory's growth moderated.
The Northern Territory’s growth was underwritten by government consumption and investment, which spiked sharply against moderately stable other factors. On the other hand, the ACT’s growth factors largely mirrored those of South Australia and the major States, however, with growth roughly equally underwritten by stimulus through household and government consumption.

Figure 11: The Northern Territory's growth was underwritten by government investment and (spiking) consumption, while the ACT’s growth was underwritten by stimulus working through both government and household consumption.
Conclusion
Growth of the overall Australian economy moderated over the March quarter following a strong recovery from lockdowns in response to the Delta variant. The moderation was due to a resurgence of imports, with the domestic economy still otherwise strong due to the ongoing effects of government stimulus. Growth in State Final Demand in the Major States (NSW & VIC) particularly offset negative growth contributed by the international sector.
Across the Federation, there were divergent results within the overall moderation:
Major States: Growth moderated in New South Wales and Victoria following the recovery from Delta variant restrictions, with Victoria seeing the lesser recovery and lesser moderation. In both states, household consumption was the primary driver of growth (unwinding JobKeeper savings) with government consumption coming in second.
Resource States: State Final Demand growth strengthened in Queensland and Western Australia, with Western Australia picking up to even stronger growth than Queensland. State governments appear to be making hay while the resource boom shines, with growth underwritten particularly by government consumption.
Festival States: Growth improved in South Australia and Tasmania, however, in Tasmania this meant a moderation of the State Final Demand recession. Improvement was underwritten by stimulus in both states, but the dependence was greater in Tasmania where government consumption is the primary driver of growth.
Territories: The Northern Territory saw growth return after a short decline, while the ACT’s growth moderated. In the Northern Territory this growth was underwritten by government investment and spiking government consumption, while the ACT’s growth was underwritten by more broad factors working through government and household consumption.
The key theme across the economy is that volumetric, real growth continues to be underwritten by stimulus working through household and government consumption.
This key theme is stronger in Queensland and Western Australia where government consumption is the primary driver underwriting State Final Demand Growth, and it is stronger again in Tasmania and the Northern Territory where it is largely alone countervailing a State Final Demand recession. In the Major States, South Australia and the ACT, State Final Demand growth is a more broad-based, with household consumption (albeit stimulated) the primary driver of growth.
We are likely to see further moderation of growth as stimulus unwinds. And of the eight economies across the Federation, the Resource States are the most vulnerable to a downturn in commodity prices as their state budgets are underwritten by the boom.
The views expressed in this note are those of the author alone and in no way reflect the views of his employer or any other party.