Key Points
The supply side of the economy reflected a system emerging from lockdowns. Professional and hospitality services were freed up, workers returned to the factory, and logistics ramped up in support. But volumes in the primary sectors (agriculture and natural resources) created a drag on growth.
New wealth accrued most strongly to non-financial companies, followed by workers. However, this reflected volatility more than a long-term trend.
National accounts: what it is, why it matters
The national accounts are the touchstone Australian economic dataset. They give us a picture of the wealth created across the Federation during a quarter year. We summarise this in a single number: Gross Domestic Product (GDP). GDP is added up in three ways:
· GDP-E: by expenditure, what some might call the “demand side” of the economy, which includes household and government consumption and investment and international trade.
· GDP-O: by output, what some might call the “supply side” of the economy, which adds gross value added by each sector of the economy.
· GDP-I: by income, what we might call the “circuit closer”, which adds up income accruing to workers, companies, governments, and landlords.
In this update we follow up on our GDP-E update with a GDP-O and GDP-I update. While these do not give us detailed breakdowns by state, they are still highly informative because they tell us which sectors are creating the most wealth, and how it’s being distributed.
As always, we use the seasonally adjusted numbers to get a little bit of the volatility stripped out. We also, as is conventional, focus on real GDP, which seeks to hold prices constant across time to get at the underlying volume of production and exchange within the economy. However, we can only do this for GDP-O, as GDP-I is only calculated as a nominal figure at current prices.
Again, as always, we like to start by looking at what sectors are creating growth using GDP-O: the “supply side”. Then, we pivot to looking at how it is being distributed between the “great estates” of Australian society using GDP-I: workers, companies, governments and landlords.
Wealth creation: which sectors are driving wealth creation?
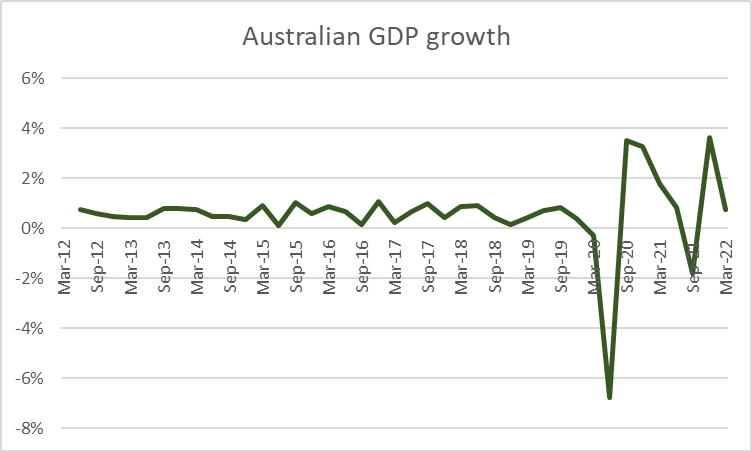
Across the Federation, the overall economy grew at a more stately yearly rate of 3.05% over the March-22 quarter, drawing back from a breakneck yearly rate of 15.3% in the December-21 quarter. This marked a moderation of the recovery following prolonged lockdowns in New South Wales in response to the Delta variant.
Figure 1: Growth moderated in the March quarter following a strong recovery from lockdowns in response to the Delta variant.
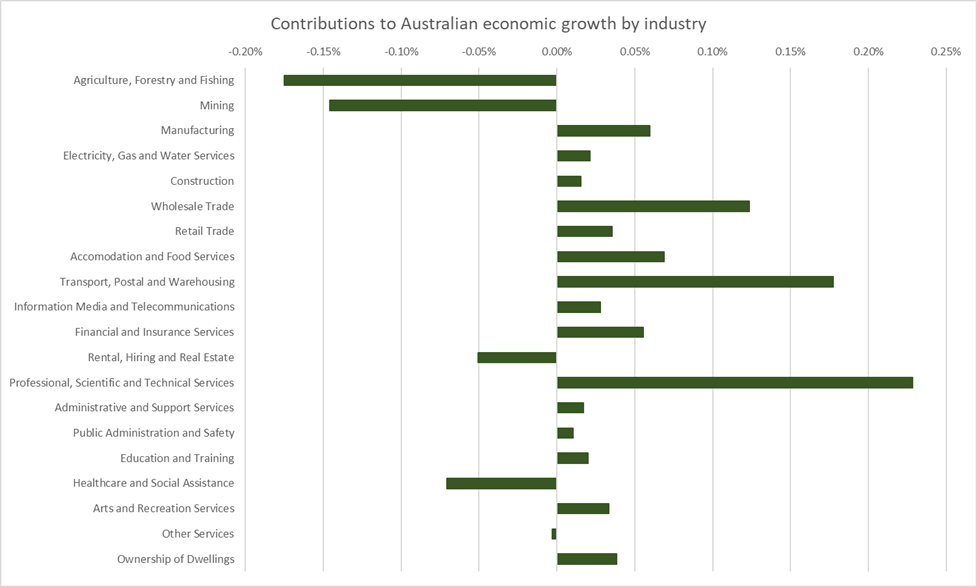
On the supply side of the economy (reflected by GDP-O), the largest contributions to growth were made by the Professional, Scientific and Technical Services Sector, followed by the Transport, Postal and Warehousing Sector, Wholesale Trade Sector, Manufacturing, and Accommodation and Food Services sectors. Only four sectors dragged on growth: Agriculture, Forestry and Fishing, Mining, Rental, Hiring and Real Estate and Healthcare and Social Assistance.
Figure 2: The supply side of the economy reflected a system emerging from lockdowns. Professional and hospitality services were freed up, workers returned to the factory, and logistics ramped up in support. But volumes in the primary sectors (agriculture and natural resources) created a drag on growth.
This very much reflects an economy emerging from severe disruptions created by the response to the Delta variant, with professional and hospitality services being freed up, workers returning to the factory, and logistics sectors firing back up.
The drag created by primary sectors (agriculture and natural resources) is contrary to the current zeitgeist of a resources boom. What it points to is that underlying volumetric declines in gross value add are being covered by strong commodity prices.
Casting an eye over the longer term, we see that despite these recent trends, the Australian economy continues to be a mining and housing economy. The strength of the drag created by the mining sector reflects the fact that it continues to be the largest contributor to Australian wealth creation by a fairly substantial margin. Only the wealth created by residential property ownership comes close.
Figure 3: The Australian economy continues to be a mining and housing economy, construction and manufacturing continue to decline, though professional, health and welfare services continue to grow as a share of GDP.
Manufacturing and construction continue to decline as wealth-creating sectors in Australia. On the other hand, Professional, Scientific and Technical Services and Healthcare and Social Assistance continue their trend of growing as wealth creating sectors.
To put it somewhat tritely: Australia is less and less a country that derives its wealth from making and building things, still a country that makes its wealth by digging stuff out of the ground and renting houses, and more and more a country that consults and cares.
Wealth distribution: how is new wealth being distributed?
When we look at nominal GDP-I, we can look at contributions made by the different sectors of the economy as that. But we can also look at the same numbers as concentrations in the distribution of the wealth created during the quarter. In Australia, we do that by breaking GDP-I down between the “great estates”: workers, companies, governments and landlords.
During the March-22 quarter, new wealth accrued most strongly to the private non-financial sector. These are all the companies across Australia that are not financial institutions. Workers accrued the second largest share of new wealth. Together, these two estates accrue the majority of Australia’s wealth, with workers accruing 45.06% and non-financial companies accruing 22.84%.
Figure 4: New wealth accrued most strongly to non-financial companies, followed by workers, the two sectors which accrue the majority of Australia's wealth.
Rather than a strong long term trend, this outcome reflected the continued volatility of non-financial company profits especially since the outset of Covid-19. Company profits have substantially more volatility than employee compensation over the past ten years, often falling behind employee compensation growth, sometimes outpacing it.
Figure 5: The strong accrual of new wealth by non-financial companies reflected volatility more than a long-term trend.
Conclusion
Growth moderated in the March quarter following a strong recovery from lockdowns in response to the Delta variant. The supply side of the economy reflected a system emerging from lockdowns. Professional and hospitality services were freed up, workers returned to the factory, and logistics ramped up in support. But volumes in the primary sectors (agriculture and natural resources) created a drag on growth.
Longer term trends suggest Australia is less and less a country that derives its wealth from making and building things, still a country that makes its wealth by digging stuff out of the ground and renting houses, and more and more a country that consults and cares.
New wealth accrued most strongly to non-financial companies, followed by workers. However, this reflected volatility more than a long-term trend.
The views expressed in this note are those of the author alone and in no way reflect the views of his employer or any other party.


