

Australian wealth creation
Australian wealth creation
June-22 National Accounts Update

Key Points
Rarely outside of war are we reminded of the criticality of logistics, but the June quarter for the Australian economy provided the exception, with the Transport, Postal and Warehousing sector making the largest contribution to supply-side growth.
Strong demand in the context of disrupted supply chains was reflected in a premium being placed on getting things to the right place at the right time for buyers domestic and global.
Longer term trends continued: the Australian economy continues to be a mining and housing economy, construction and manufacturing continue to decline, and professional, health and welfare services continue to grow as a share of GDP.
National accounts: what it is, why it matters
The national accounts are the touchstone Australian economic dataset. They give us a picture of the wealth created across the Federation during a quarter year. We summarise this in a single number: Gross Domestic Product (GDP). GDP is added up in three ways:
· GDP-E: by expenditure, what some might call the “demand side” of the economy, which includes household and government consumption and investment and international trade.
· GDP-O: by output, what some might call the “supply side” of the economy, which adds gross value added by each sector of the economy.
· GDP-I: by income, what we might call the “circuit closer”, which adds up income accruing to workers, companies, governments, and landlords.
In this update we follow up on our GDP-E update with a GDP-O update. While these numbers do not give us detailed breakdowns by state, they are still highly informative because they tell us which sectors are creating the most wealth on the supply side of the economy.
As always, we use the seasonally adjusted numbers to get a little bit of the volatility stripped out. We also, as is conventional, focus on real GDP, which seeks to hold prices constant across time to get at the underlying volume of production and exchange within the economy.
Wealth creation: which sectors are driving wealth creation?
Across the Federation, the overall economy gathered a little pace over the June-22 quarter, growing at a yearly rate of 3.62% from a (revised) 2.87% in the March-22 quarter. We would probably consider this a consolidation of gains achieved as the spectre of Covid-19 lockdowns faded.

Figure 1: Growth consolidated over the June quarter as the spectre of Covid-19 lockdowns faded.
On the supply side of the economy (reflected by GDP-O), the largest contributions to growth was made by the Transport, Postal and Warehousing industry by a fairly substantial margin. The second strongest contributions were roughly equal contributions made by the Accommodation and Food Services and Healthcare and Social Assistance sectors. Manufacturing, Construction, Wholesale Trade and Public Administration and Safety on the other hand dragged on growth.
This is probably reflective of an economy in which the spectre of Covid-19 lockdowns is fading, which is both facing and exploiting a spike in global commodity prices, and which is working to respond to global supply chain shortages. In such an economy we would expect front facing services like Accommodation and Food Services, Healthcare and Social Assistance, and a range of other ancillary services which support a return to “normal” work and life to grow strongly. We would expect the gross value add of manufacturing, construction, and wholesale trade to be squeezed by higher input costs. But we would also expect the value add by the logistics sector to grow enormously with the challenges of disrupted supply chains against burgeoning domestic and global demand.
In short, in the June quarter, we might say that the Australian economy reflected one where a premium is being placed on getting things to the right place at the right time for buyers domestic and global.
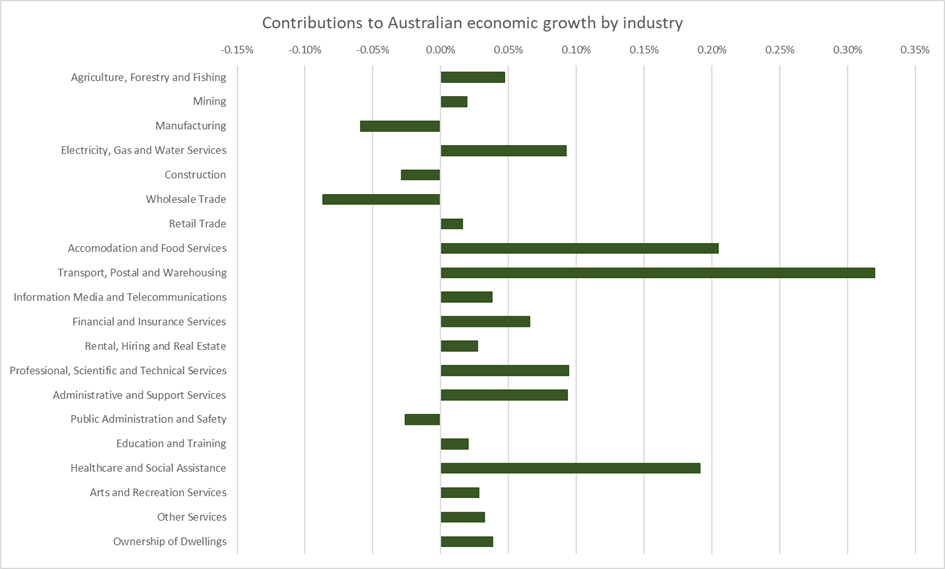
Figure 2: The supply side is reflective of an economy in which a premium is being placed on getting things to the right place at the right time for buyers domestic and global.
Casting an eye over the longer term, we see the continuation of some long term trends. The Australian economy continues to be dominated by mining and home ownership, but short term commodity and housing price booms cover over the fact that these sectors continue to decline as a share of GDP on a volumetric basis. Construction and Manufacturing continue to decline as wealth-generating sectors of the economy in real, volumetric terms, while Healthcare and Social Assistance and Professional, Scientific and Technical Services continue to grow.
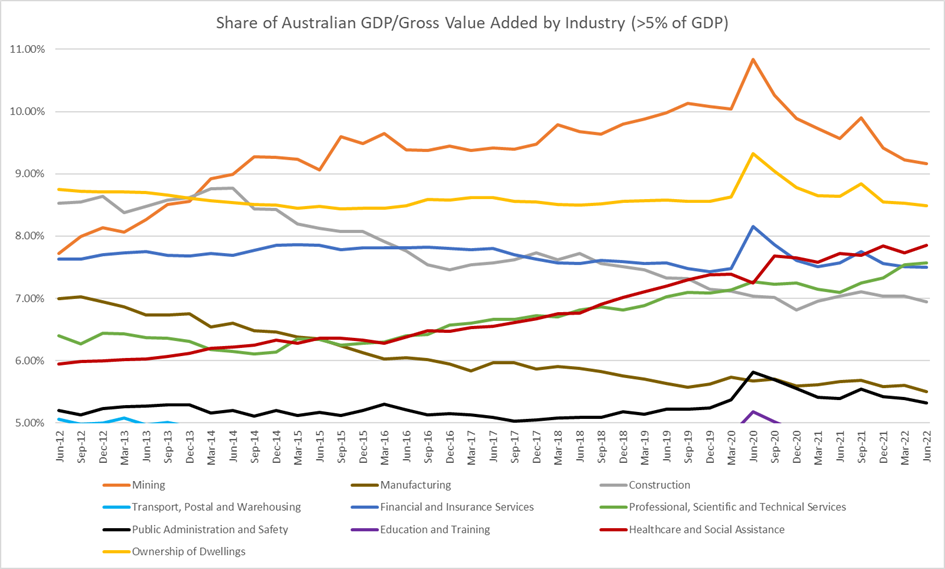
Figure 3: The Australian economy continues to be a mining and housing economy, construction and manufacturing continue to decline, though professional, health and welfare services continue to grow as a share of GDP.
As we are to become accustomed to putting it somewhat tritely: Australia is less and less a country that derives its wealth from making and building things, still a country that makes its wealth by digging stuff out of the ground and renting houses, and more and more a country that consults and cares. We should not be prematurely triumphant about this trend. It may signal a country that is increasingly post-industrial and transitioning to high value-add services. But it may also reflect a country that is becoming increasingly dependent on the provision of public and consulting services to government, paid for by cannibalising the resources, manufacturing and construction sectors.
Conclusion
Growth in the Australian economy consolidated over the June quarter as the spectre of Covid-19 lockdowns faded. On the supply side of the economy, strong demand in the context of disrupted supply chains was reflected in a premium being placed on getting things to the right place at the right time for buyers domestic and global. Rarely outside of war are we reminded of the criticality of logistics, but the June quarter for the Australian economy provided the exception.
Casting an eye over longer term trends, the Australian economy continues to be a mining and housing economy, construction and manufacturing continue to decline, though professional, health and welfare services continue to grow as a share of GDP.
The views expressed in this note are those of the author alone and in no way reflect the views of his employer or any other party.