

Australia at the Till
Australia at the Till
June 2022 CPI Update

Key Points
Across the Federation, inflation rose not only at a decadal high, but the highest rate since the 70s and 80s, driven particularly by transport and then housing costs.
Inflation seems to be the reward for strong interstate borders: being strongest in the Resource States by a good margin, followed by the Festival States and Territories, with inflation lowest in the Major States and New South Wales by a good margin.
The Festival States suffered most from oil supply disruptions, with the Territories similar but not so strongly and the Major States mirroring national primary drivers. Housing costs were more potent in the Resource States, and almost the strongest inflation category in Queensland.
Note: some corrections were made to the calculations underlying the charts in this piece on 30/08/2022, with some minor changes in interpretation and analysis resulting.
CPI: what it is, why it matters
The Consumer Price Index (CPI) is, alongside the labour force survey, one of the most important indicators for the Australian economy because, like that survey, it directly informs us about the everyday lives of Australians by giving us a sense of how far the dollars in their pocket go. The key figure in this survey is the consumer price index, which allows us to calculate the overall change in prices quarter to quarter of a representative basket of goods purchased by the Australian consumer. An easier comparison CPI allows us to calculate is the yearly change in the price of a basket of goods: we typically refer to this number as “the” inflation rate.
The national CPI is constructed from observations at each of the capital cities across the Federation (Sydney, Melbourne, Brisbane, Adelaide, Perth, Hobart, Darwin and Canberra). We are also given index numbers for each of the components of the index – which means we can calculate which goods and services are contributing most to inflation. These numbers are not seasonally adjusted, which is appropriate as they speak to the actual prices faced by Australian families across the Federation.
As usual, we begin by looking at the inflation rate at an aggregate level across Australia and what is driving and dragging on it. We quickly dig beneath this number to look at the inflation rate in each of the city-states, pairing them as twins: first the Major States (New South Wales & Victoria), then the Resource States (Queensland & Western Australia), then the Festival States (South Australia & Victoria) and finally the Territories (Northern Territory & Australian Capital Territory). We coined the term “Festival States” (in the sense of “Feast”) to call to mind their comparative advantage in food, wine, and general high culture. This gives us a rich view of the factors driving the prices facing Australians at the till across the Federation.
The Till across the Federation: where’s the dollar eroding quickest?
Inflation rose to a yearly rate of 6.14% in the June quarter of 2022, up from 5.09% in March. Obviously this is the highest rate in a decade, but it is also the highest rate since the high-inflation decades of the 70s and 80s when the cash rate rose to 17%. Transport costs displayed the strongest inflation by a good amount, driven by global oil disruptions, followed by housing costs (rent and house prices).
Figure 1: Inflation rose not only to a decadal high, but the highest rate since the 70s and 80s, driven particularly by transport and housing costs.
Behind these two primary drivers followed furnishings, household equipment and services (reflecting the housing boom), food and beverages (reflecting supply chain and oil disruptions). Roughly equal with these, surprisingly, were education costs alongside recreation and culture – probably reflecting shortages in the labour market.
Across the Federation, price rises were fastest in the Resource States (Western Australia and then Queensland) by a good margin. The Festival States and Territories followed behind in a close cluster (the Northern Territory, followed by Tasmania, South Australia then the ACT). Inflation was lowest in the Major States, with New South Wales reporting the lowest inflation by a good margin. Indeed, New South Wales was the only state to come in under the national average by an appreciable margin.
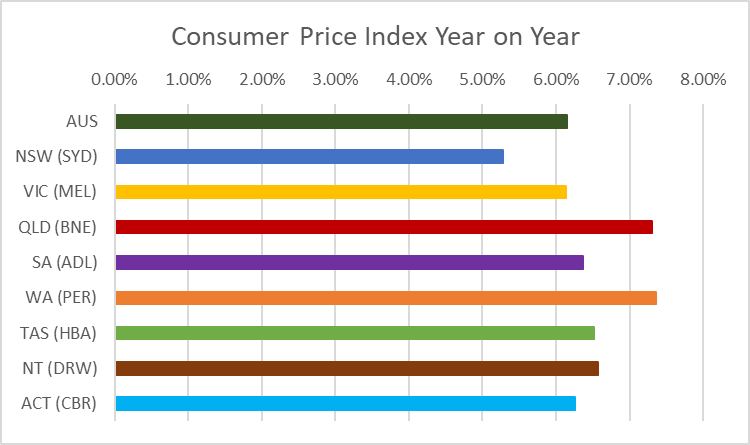
Figure 2: Inflation was fastest in the Resource States by a good margin, followed by the Festival States and Territories, with inflation lowest in the Major States, with NSW the slowest by a good margin.
Major States: New South Wales and Victoria
Inflation was lowest in the Major States by a good margin, though it still rose from 4.39% to 5.28% yearly in New South Wales and 4.55% to 6.13% in Victoria. Victoria came in at roughly the Federal average, with New South Wales substantially lower. This continued a trend of New South Wales consistently either tracking or beating the national inflation rate.
The drivers of inflation in the major states roughly mirrored the drivers nationally. In both, transport costs displayed the strongest inflation, followed at a distance by housing costs. In Victoria, furnishings, household equipment and services and food and beverages displayed the strongest inflation, with education following strongly. In New South Wales by contrast, food and beverage costs displayed inflation almost as strong as housing, followed by furnishings, household equipment and services, with education just edging out recreation and culture within the secondary drivers.
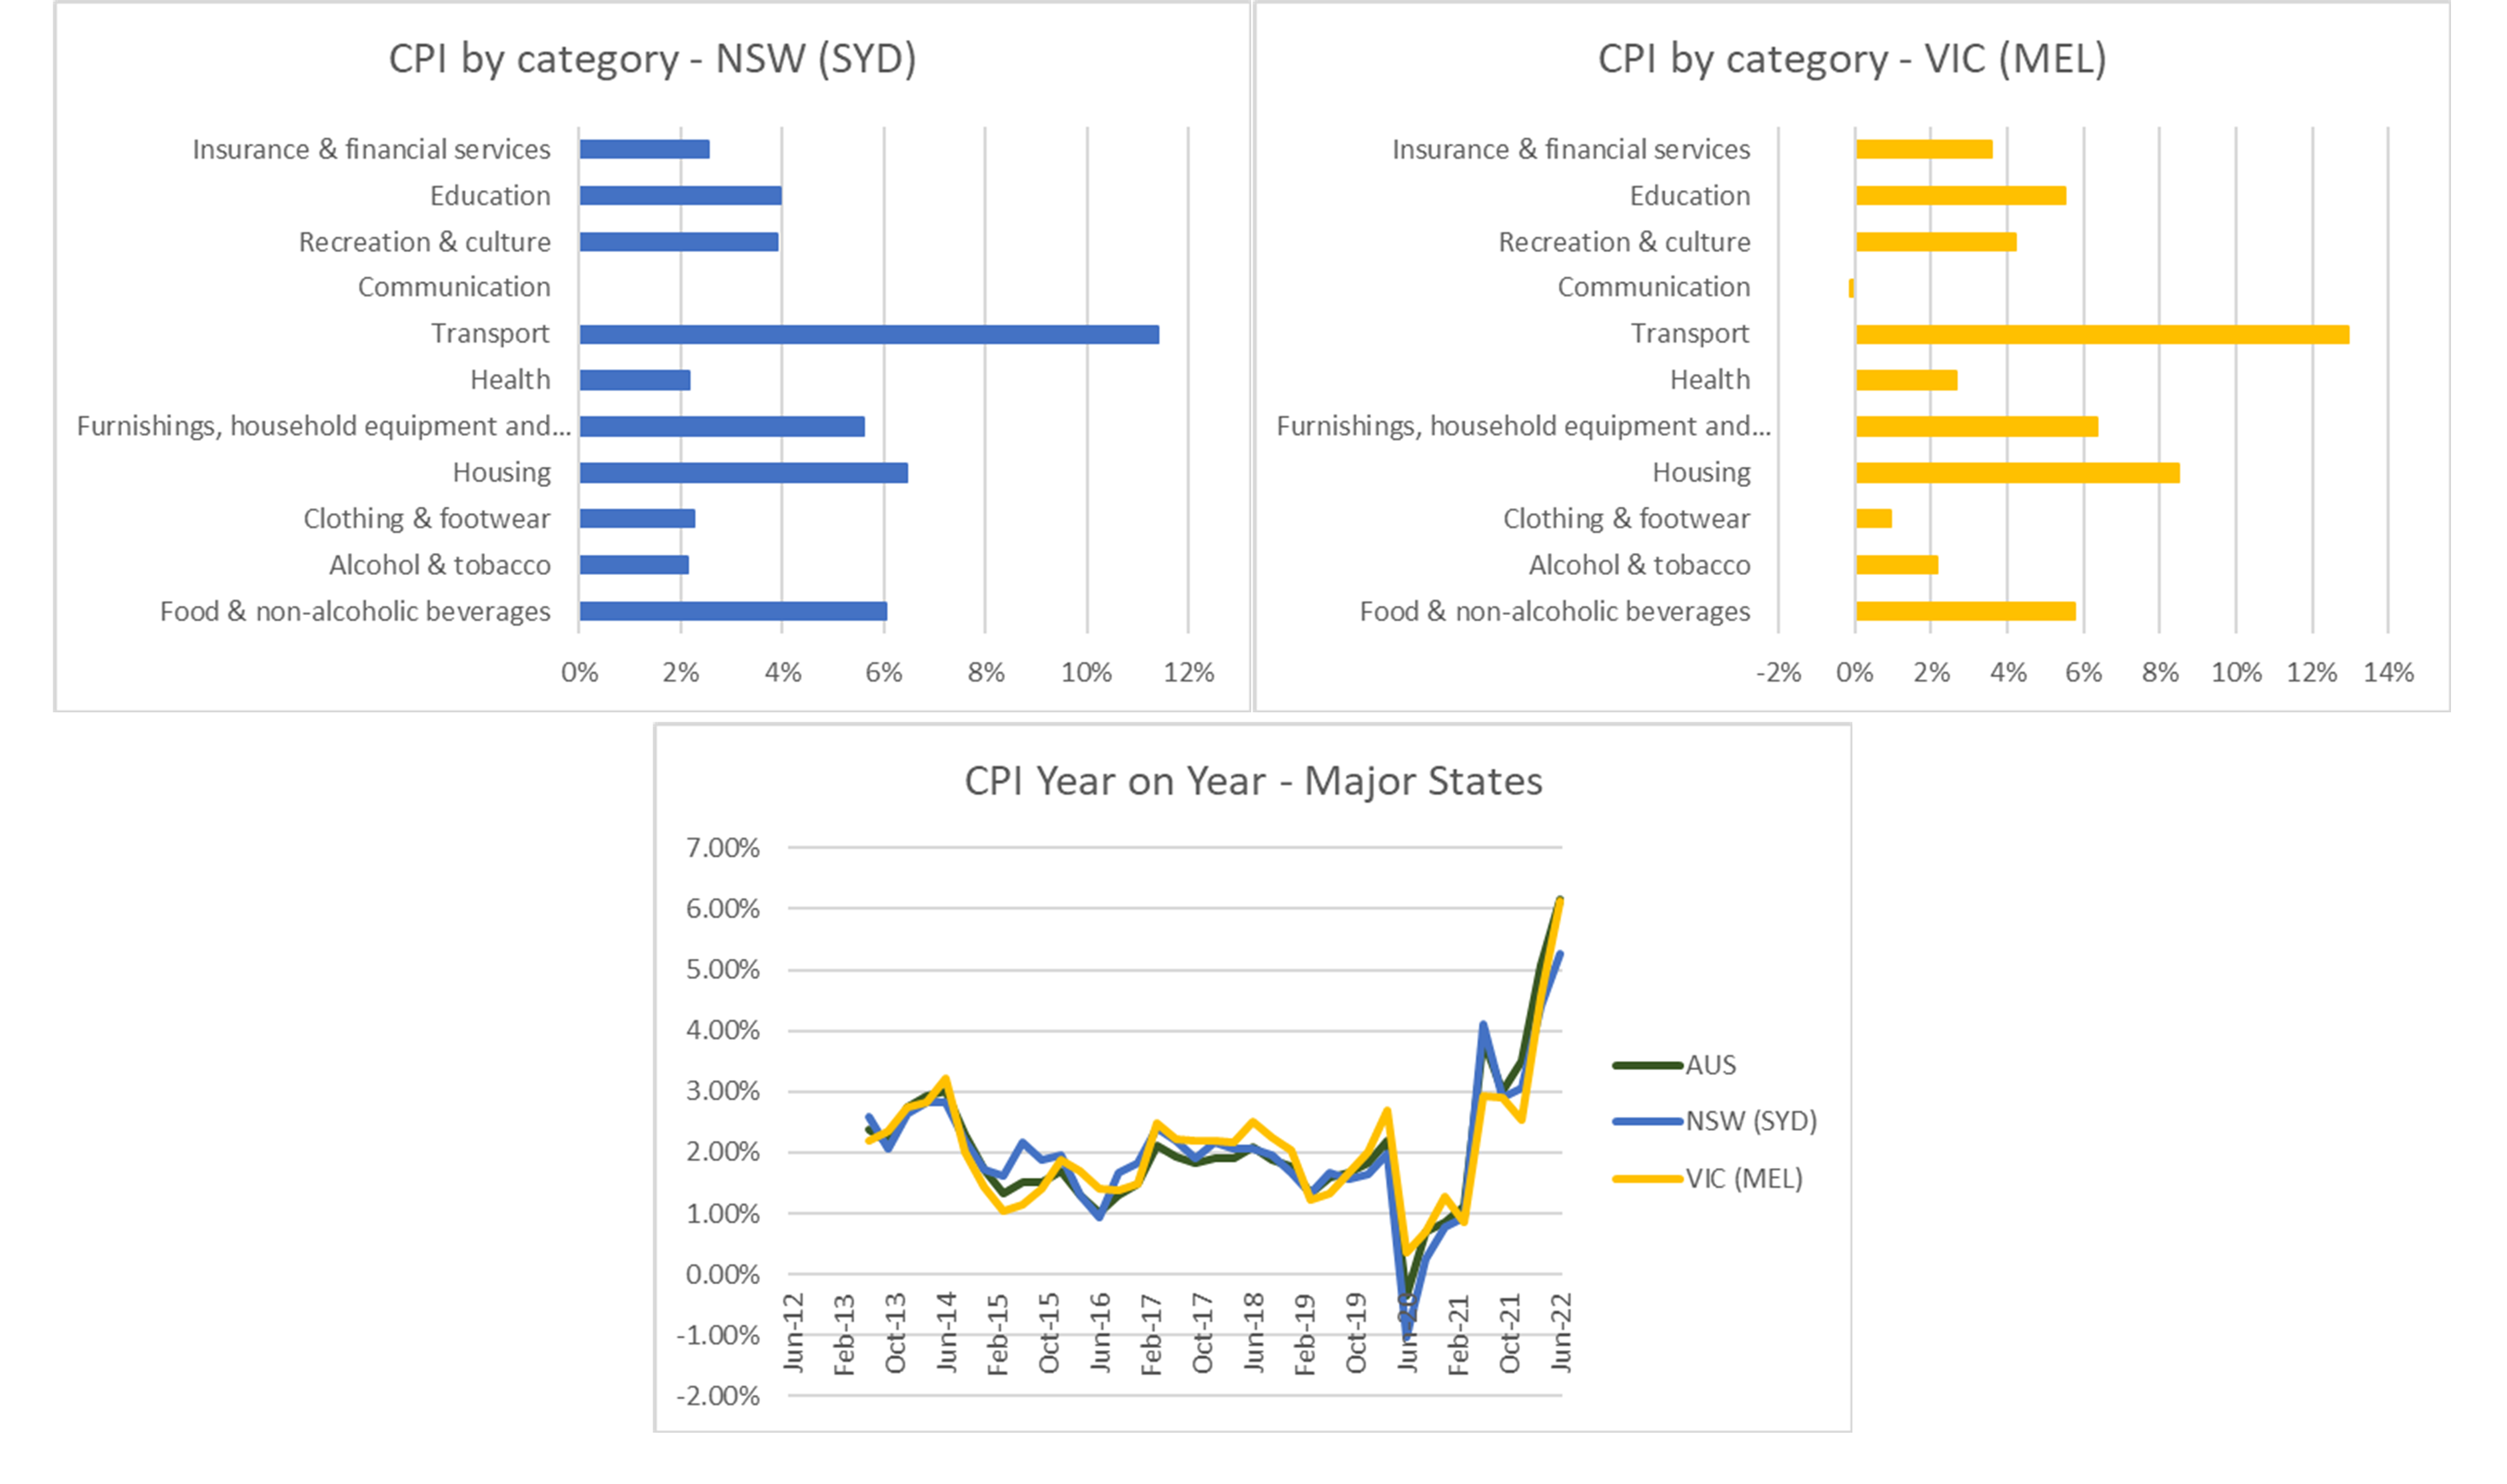
Figure 3: Inflation in the Major States primary drivers roughly mirrored the national drivers.
The Resource States: Queensland and Western Australia
Inflation was highest in the resource states by a good margin, rising from 6.01% to 7.3% in Queensland, but slowing in Western Australia from 7.59% to 7.36% in Western Australia. Both Resource States have been outpacing the Federation since early 2021, probably reflecting the fact that both were largely unaffected by lockdowns behind strongly closed interstate borders. As a result, stimulus has had the effect of stimulating the Resource State economies where it kept the Major States afloat through disruptions created by the response to Covid-19.
In both Resource States, housing was a much stronger contributor to inflation than across the rest of the Federation. In Queensland, housing costs displayed strong enough inflation they were almost the strongest inflationary category over transport costs. This probably reflects interstate migration from the lockdown-stricken Major States to States protected from lockdown by strong border restrictions. Secondary drivers were more evenly spread in the Resource States, with all but communication making fairly strong, roughly similar contributions to inflation.
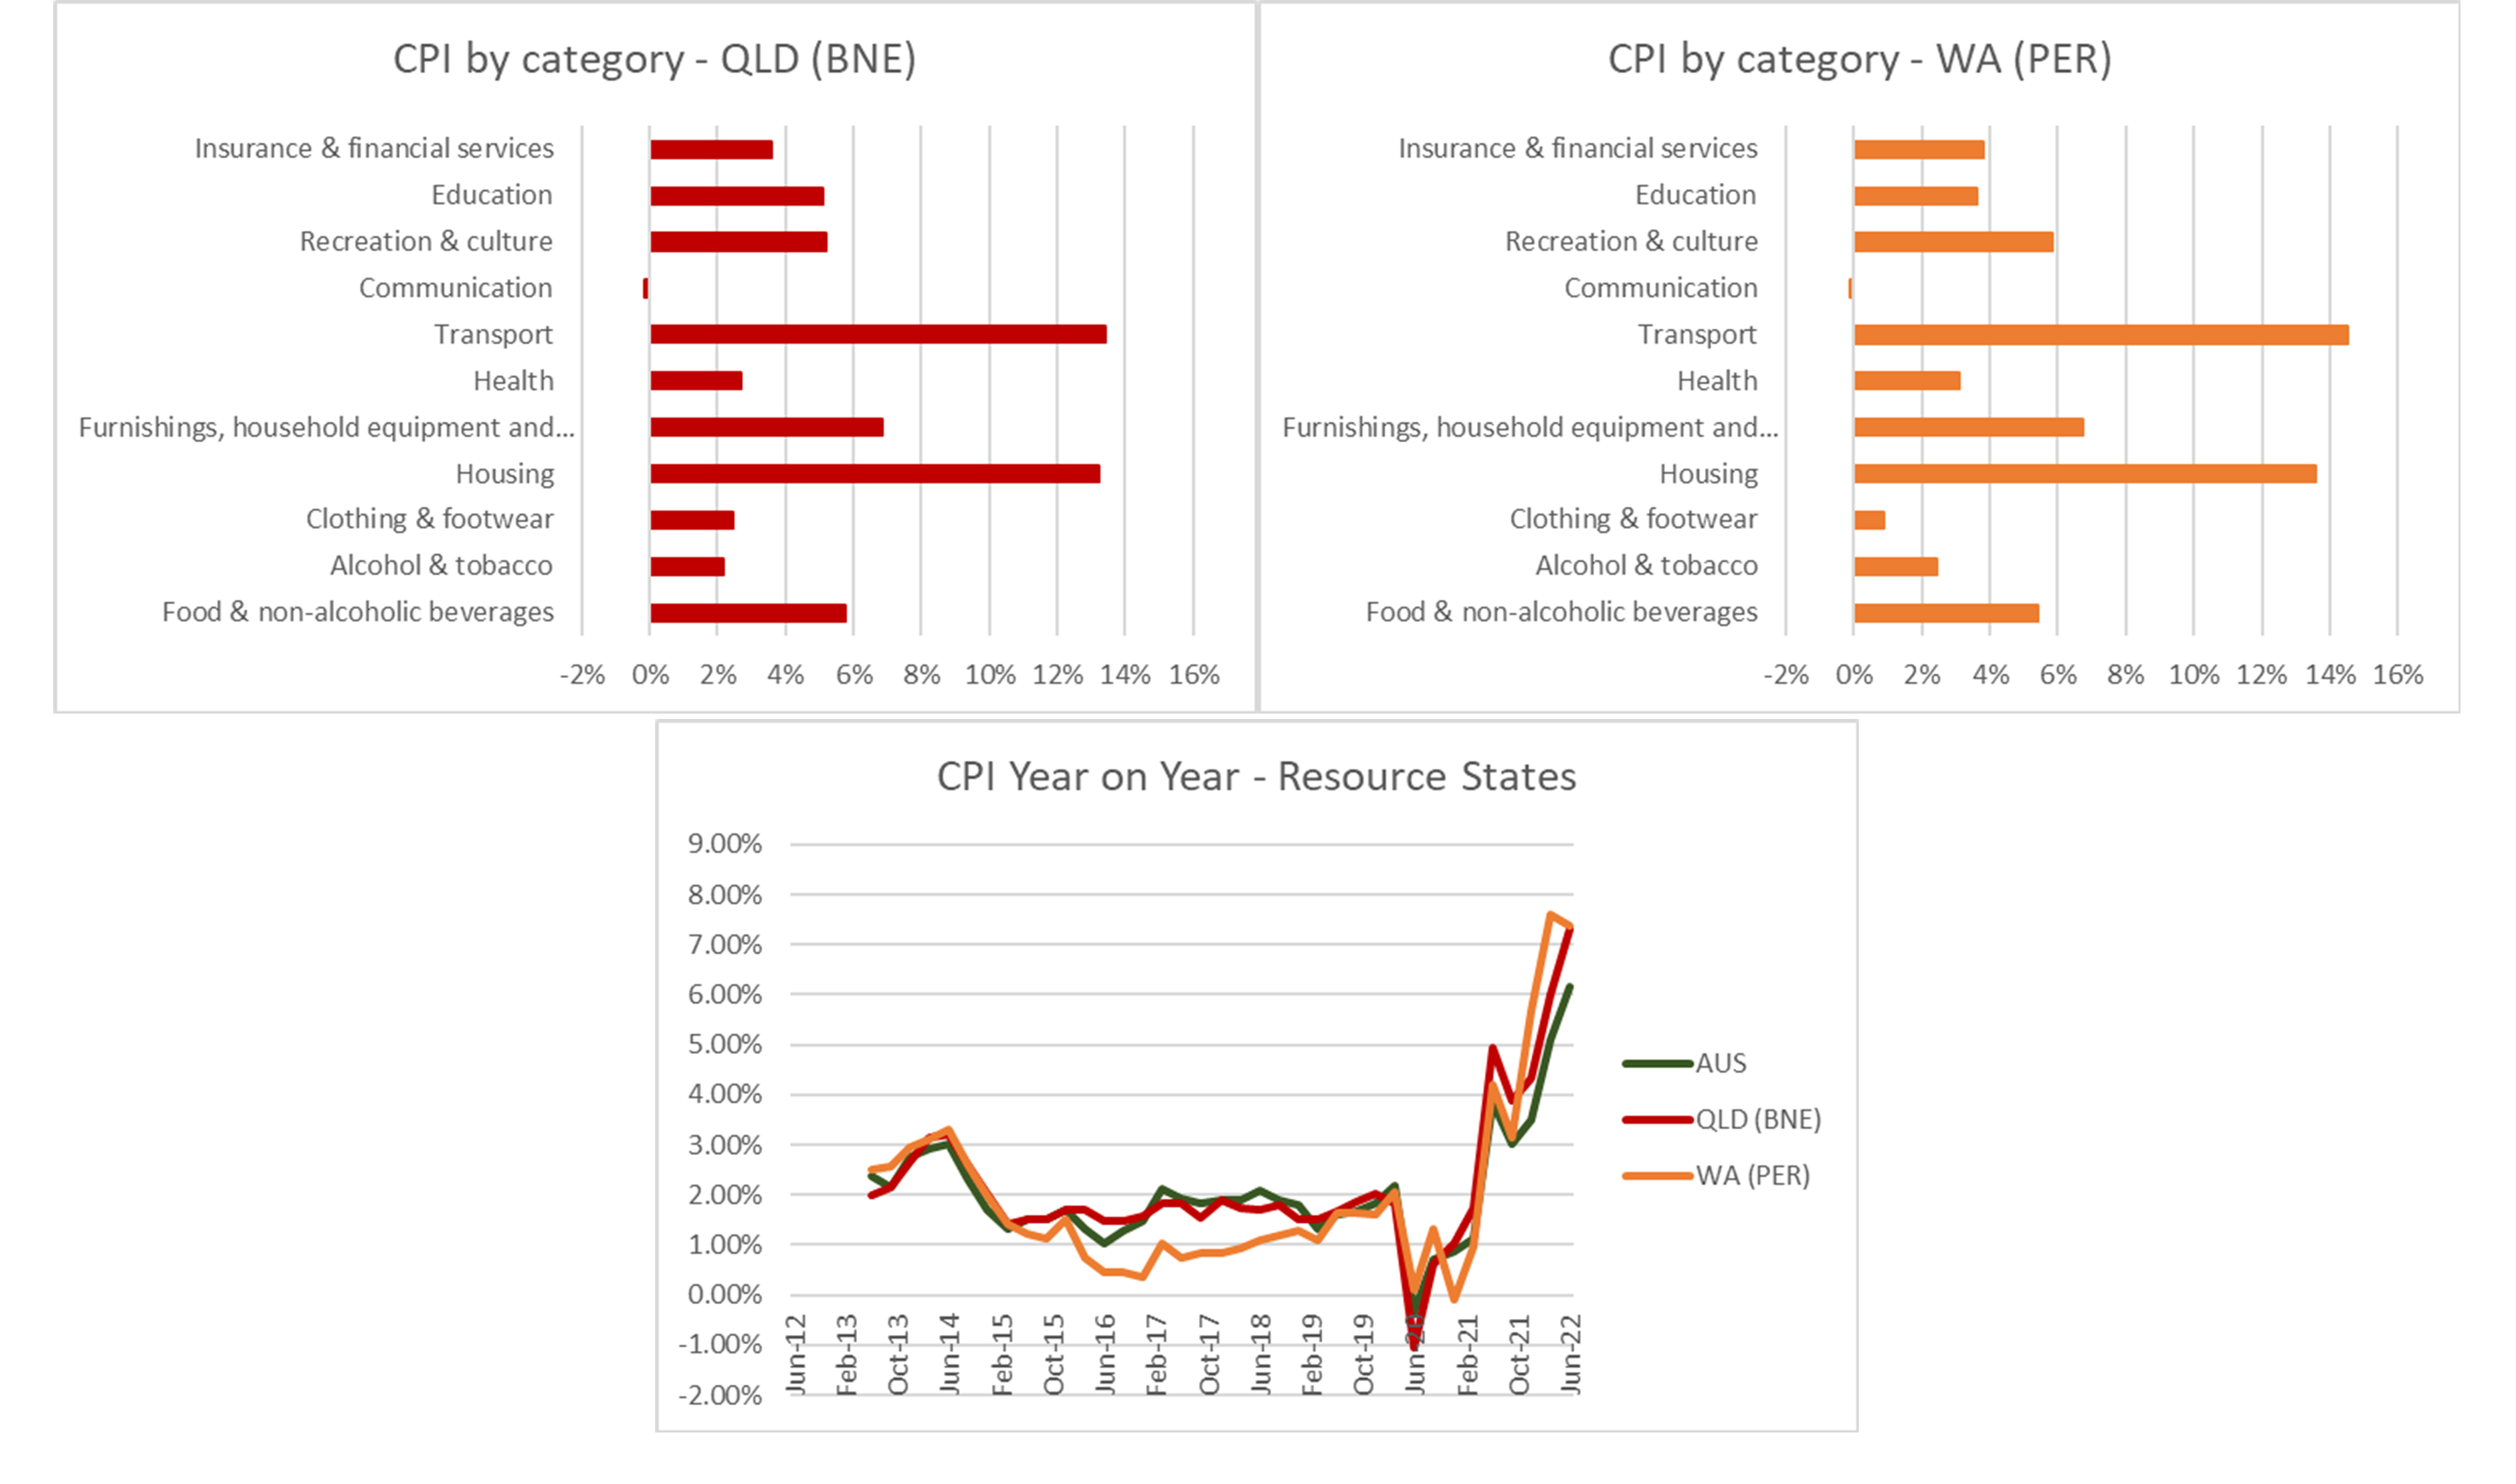
Figure 4: Housing costs were a much more potent driver of inflation in the Resource States, being almost the strongest inflationary category in Queensland.
The Festival States: South Australia and Tasmania
Inflation was slightly higher in the Festival States than the national average, rising from 4.69% to 6.37% in South Australia and 5.82% to 6.51% in Tasmania. Both States continued to display a characteristic volatility relative to the national rate. Tasmania has consistently outpaced the Federation, while South Australia has on average tracked it with some variation.
Transport costs were a more potent driver of inflation in the Festival States than even the Major States, with housing costs coming in a comparatively distant second. All categories but communications and clothing and footwear displayed roughly equivalent and strong inflation. Inflation is therefore very much more a phenomenon of disruptions in the global oil supply than elsewhere in the Federation.
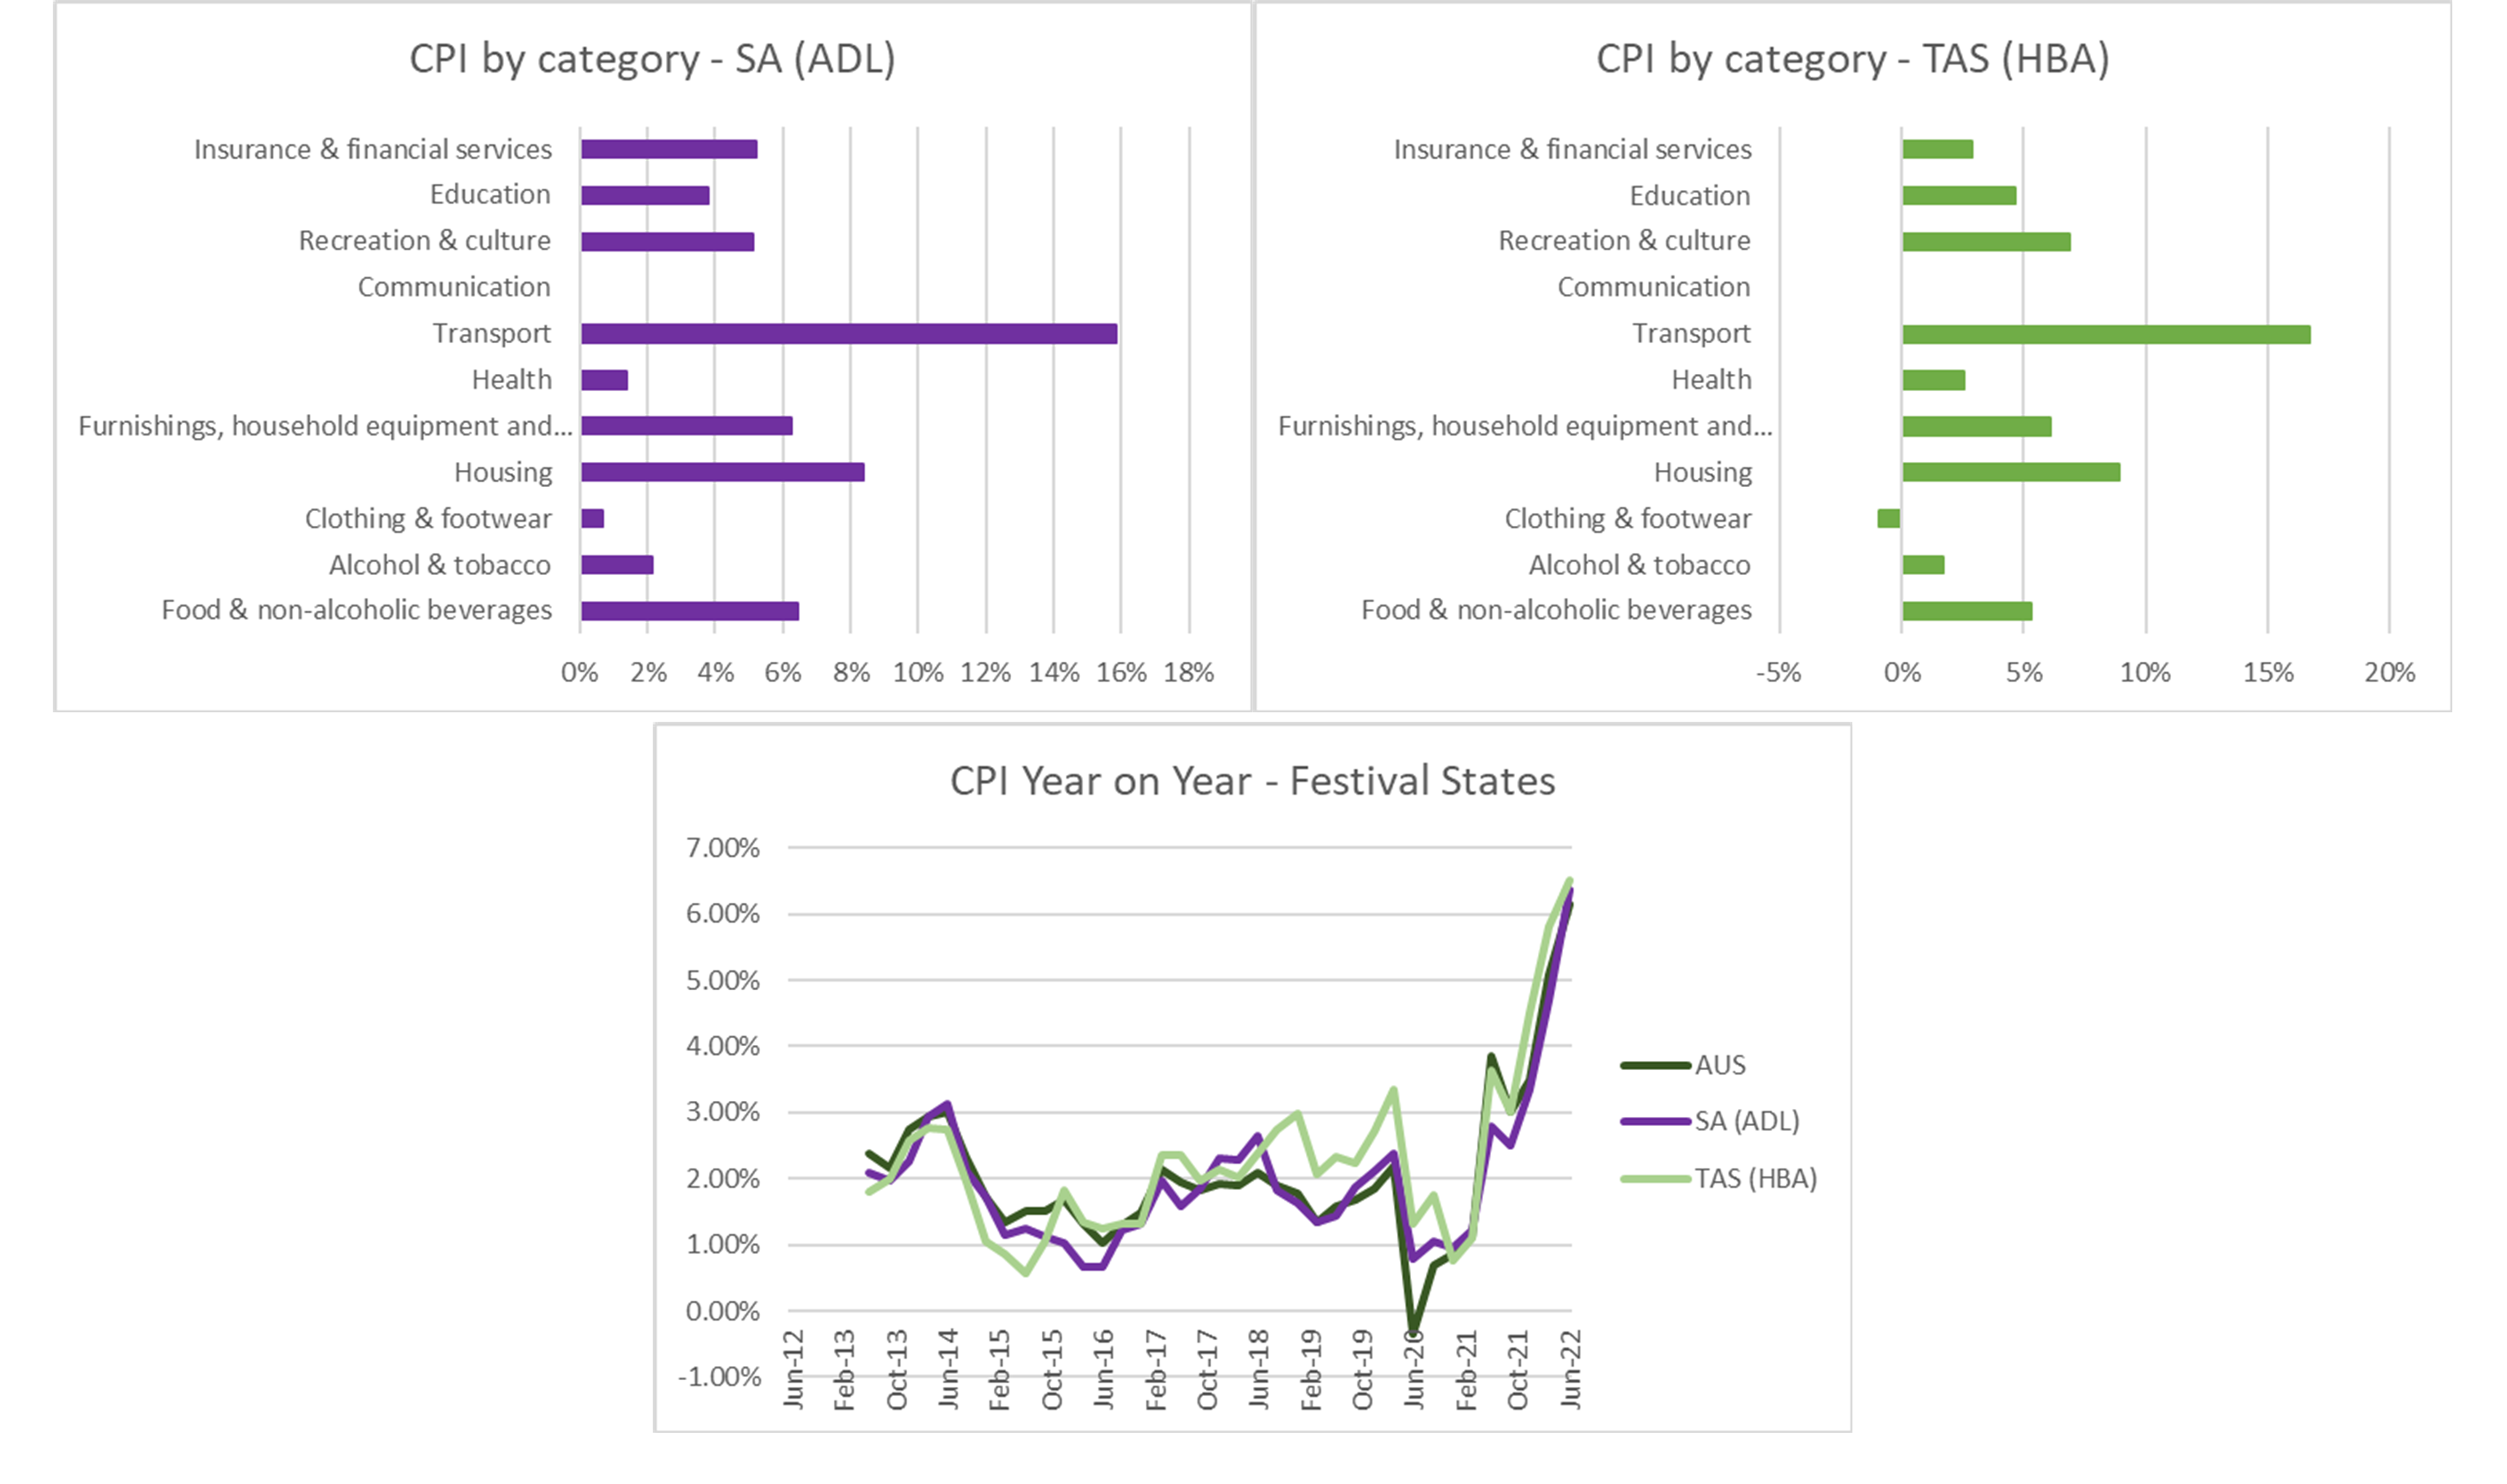
Figure 5: Inflation is very much more a function of oil supply disruptions in the Festival States, with transport costs by far the strongest contributors to inflation.
The Territories: Northern Territory and Australian Capital Territory
The Territories are characterised, as in most things, by significant volatility in inflation relative to the rest of the Federation. However, in the June quarter 2022 both came in roughly around the natural average. After plateauing since a sharp spike in early 2021, inflation in the Northern Territory jumped from 5.51% to 6.57%, while in the ACT it continued to rocket from 5.37% to 6.26% after a brief respite over 2021.
In both Territories, transport costs displayed the strongest inflation, with significant volatility underneath this. In the Northern Territory, insurance and financial services were the secondary driver of inflation by a good margin, and only then housing costs making their contribution. In the Australian Capital Territory, housing was closely followed by household equipment and services and education in a pattern suggestive of continuing population growth.
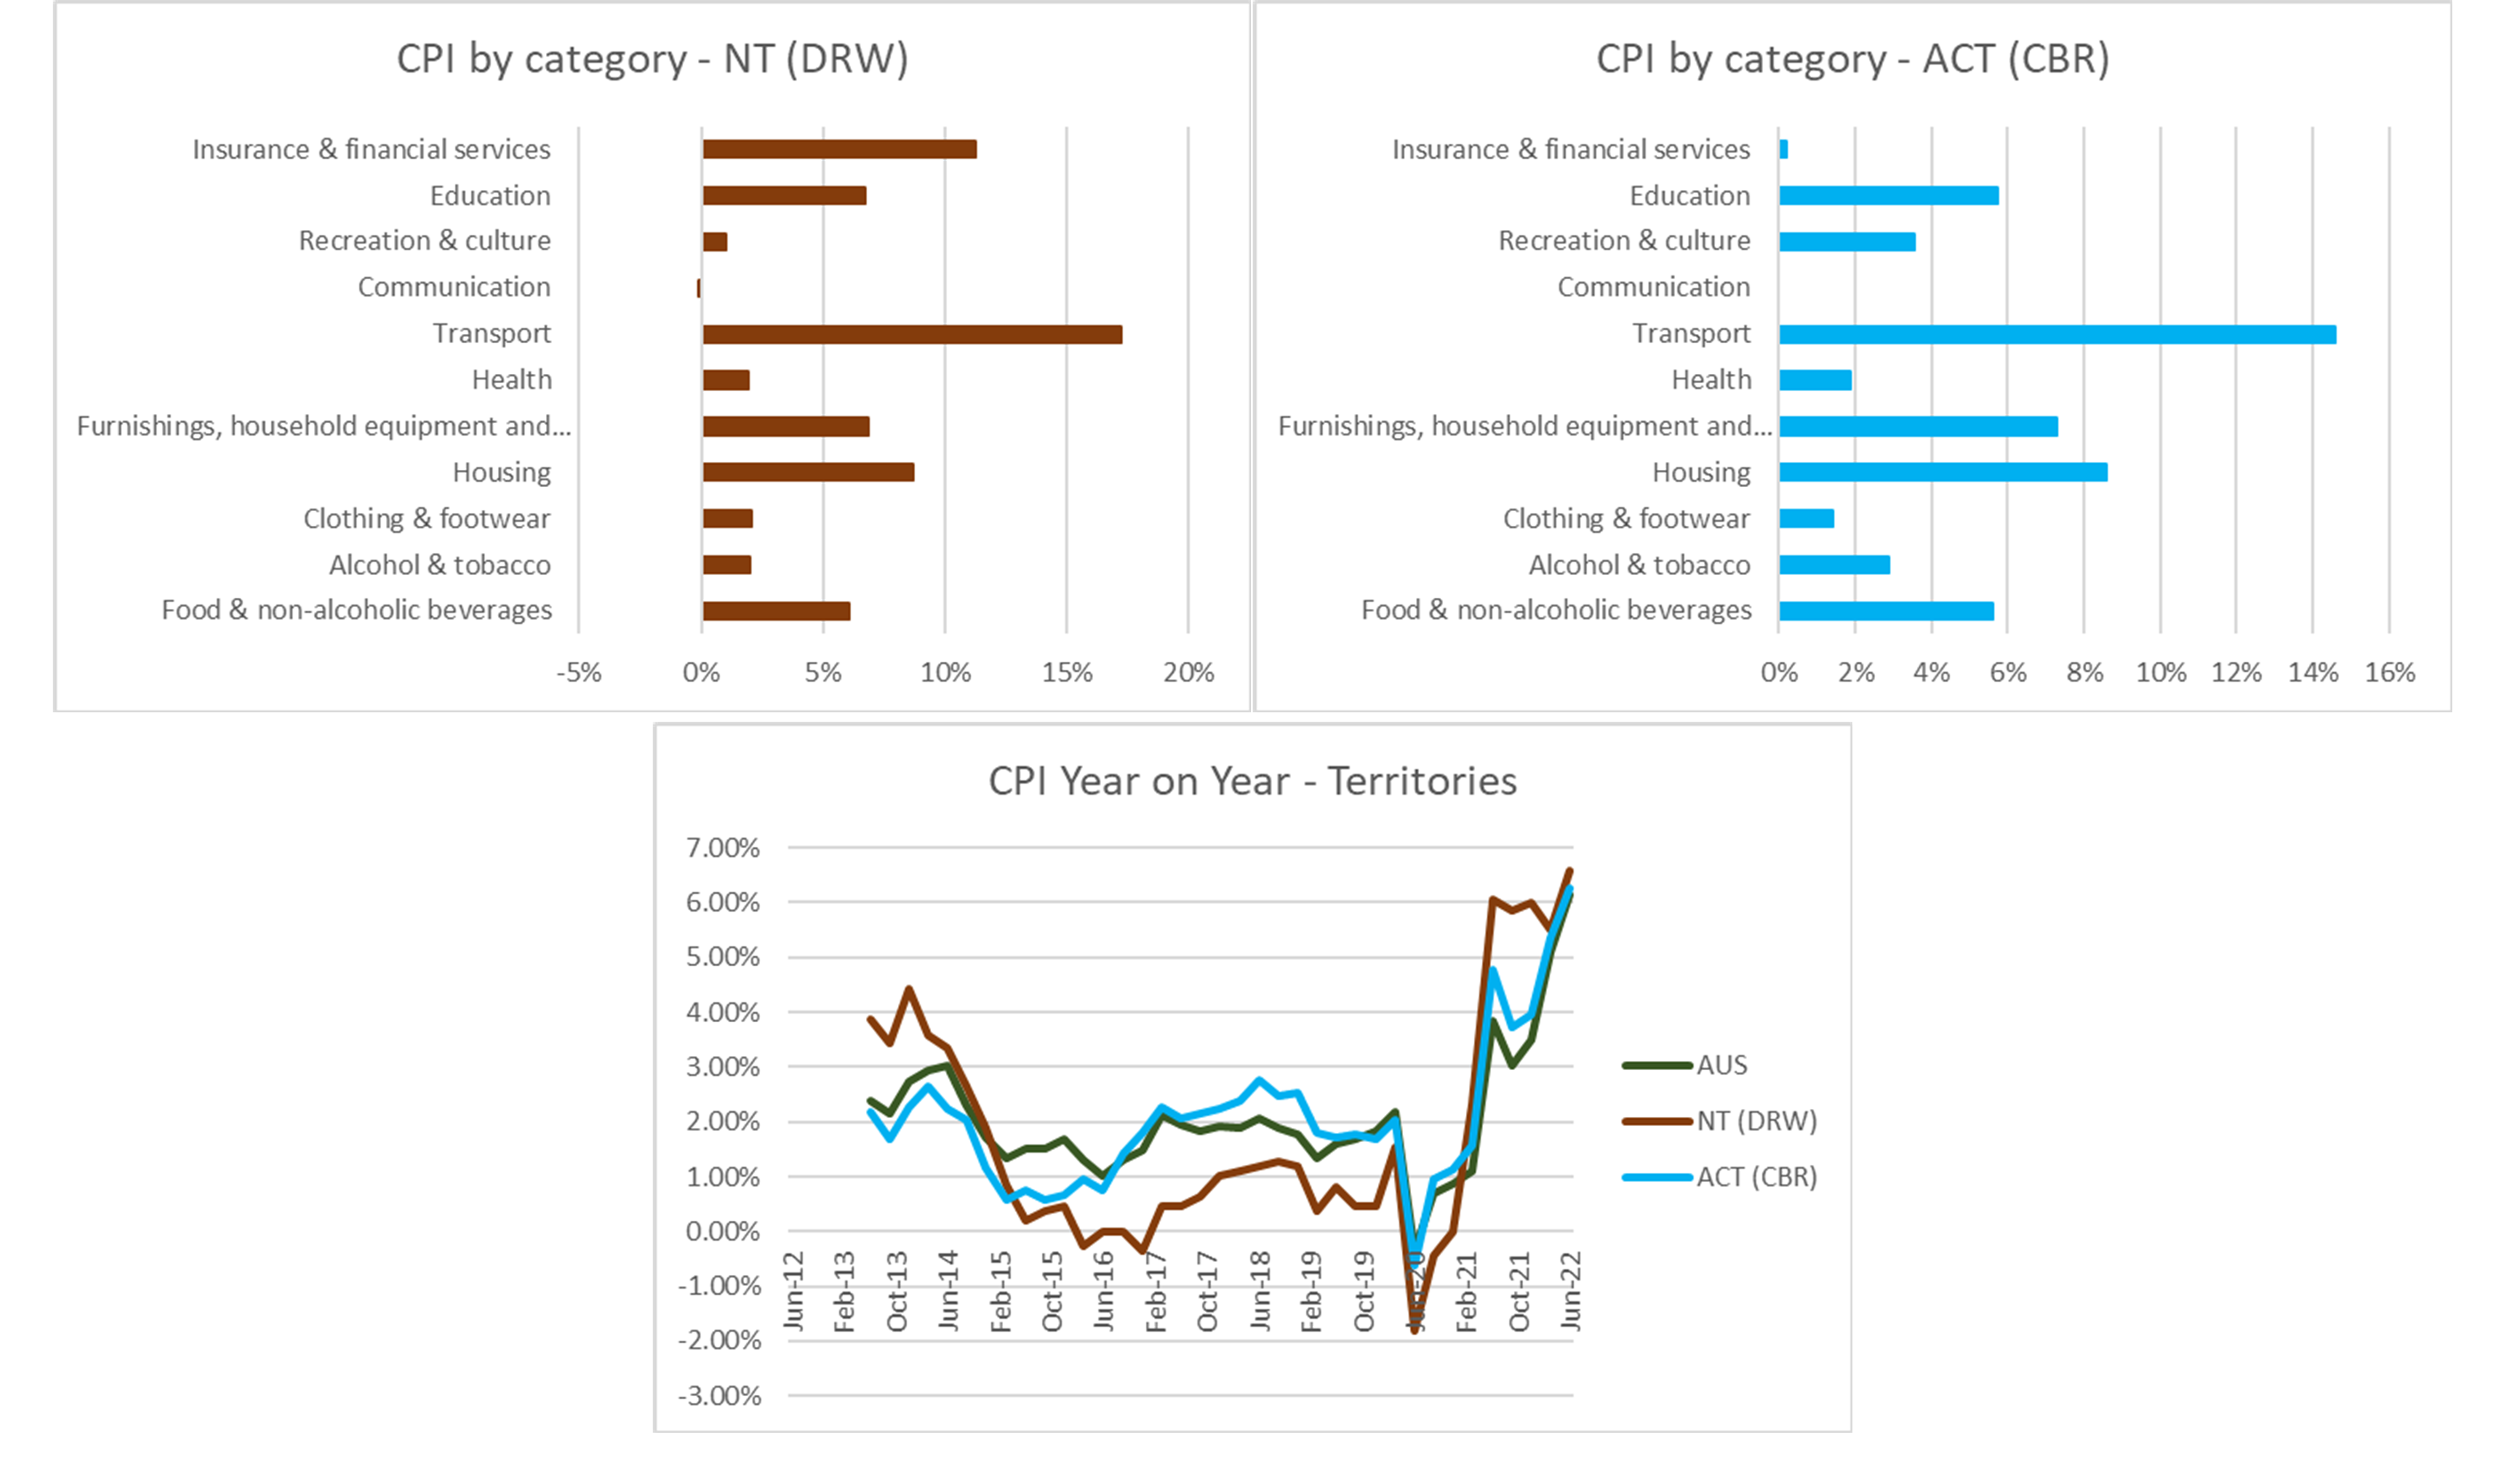
Figure 6: In the Territories, transport costs were the primary driver of inflation, with more volatility across other categories, the ACT more reflective of population growth.
Conclusion
Across the Federation, inflation rose not only at a decadal high, but the highest rate since the 70s and 80s, driven particularly by transport and then housing costs. Inflation was strongest in the Resource States by a good margin, followed by the Festival States and Territories, with inflation lowest in the Major States and New South Wales by a good margin. Thus, inflation seems to be the reward for strong interstate border closures which shielded the Resource States from lockdowns.
Across the Federation, there were variations on the theme of oil supply disruptions and housing booms. The Festival States by far suffered most from oil supply disruptions, with transport costs by far the strongest contributors to inflation. In the Territories, transport costs were also the primary driver of inflation, but with more volatility across remaining categories. By contrast, in the Resource States, housing costs were a more potent driver of inflation against the rest of the Federation, being almost the strongest inflation category in Queensland. New South Wales and Victoria largely mirrored the national primary drivers.
The views expressed in this note are those of the author alone and in no way reflect the views of his employer or any other party.